Here is a sample that showcases why we are one of the world’s leading academic writing firms. This assignment was created by one of our UK assignment writers and demonstrated the highest academic quality. Place your order today to achieve academic greatness.
The two data sets, 1) strength data and 2) pain data was analysed in using independent sample t-test using SPSS.
Using the strength data comparison of average torque values (flexion/ extension) in injured limb between BFR and HL-RT groups and in uninjured limb between BFR and HL-RT groups at pre and 4 week timelines at each testing speed (60, 150, 300) were compared using the t-test and their respective results are given in the appendix section. The Levene’s test for equality of variances was used to determine the statistically significant difference between the variances of the two compared groups. The results show that there was significant difference between the injured limb knee flexion after 4 weeks between BFR and HL-RT at Torque 60/s and 150/s as their sig. (2-tailed) value of the t-test for equality of Means were 0.022 and .001, which were less than 0.05.
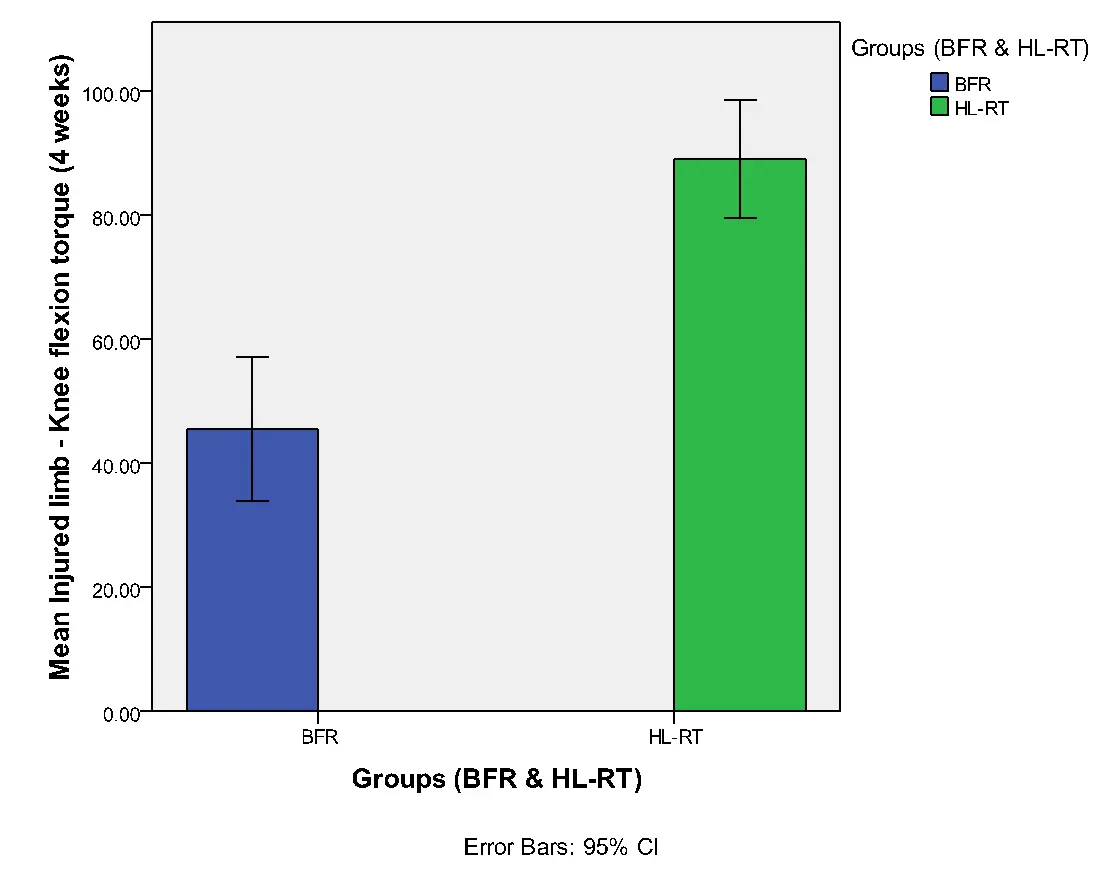
The bar chart results given below in figures 1 and 2 also indicate a significant difference between the injured limb knee flexion after 4 weeks between BFR and HL-RT at Torque 60/s and 150/s.
Figure 1 Mean injured limb-knee flexion torque (4 weeks) at Torque 60/s
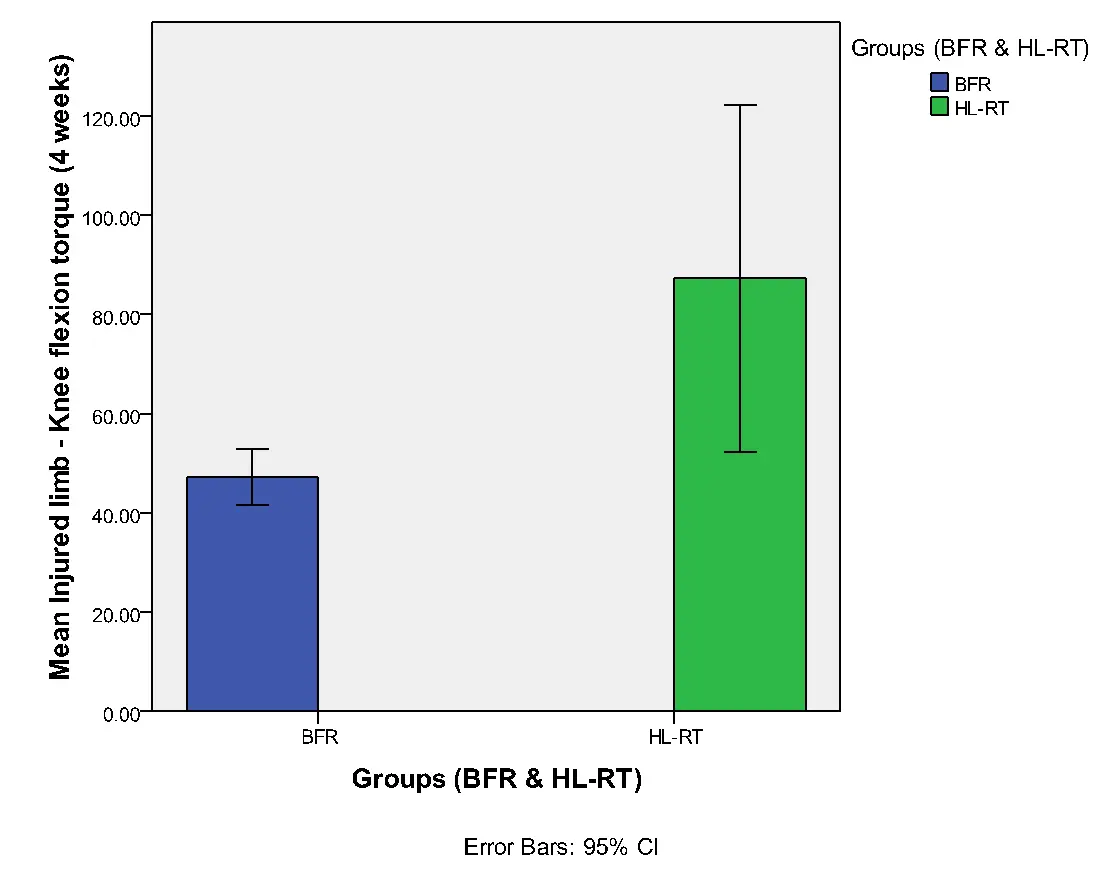
Figure 2 Mean injured limb-knee flexion torque (4 weeks) at Torque 150/s
Besides, the results show that there was significant difference found in uninjured limb after 4 weeks between BFR and HL-RT at Torque 60/s and 150/s as their sig. values were less than 0.05. The bar chart results given below in figures 3 and 4 also indicate a significant difference between the uninjured limb after 4 weeks between BFR and HL-RT at Torque 60/s and 150/s.
Figure 3 Mean unaffected limb-knee flexion torque (4 weeks) at Torque 60/s
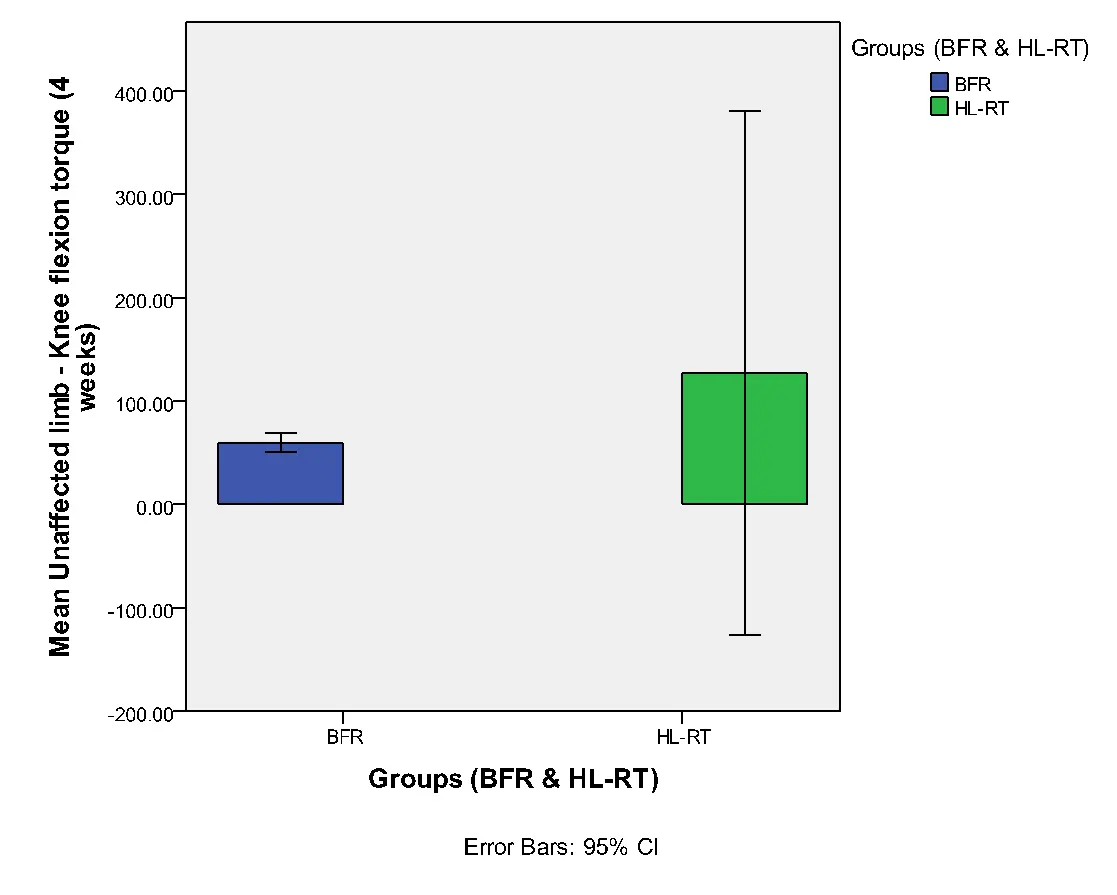
Figure 4 Mean unaffected limb-knee flexion torque (4 weeks) at Torque 150/s
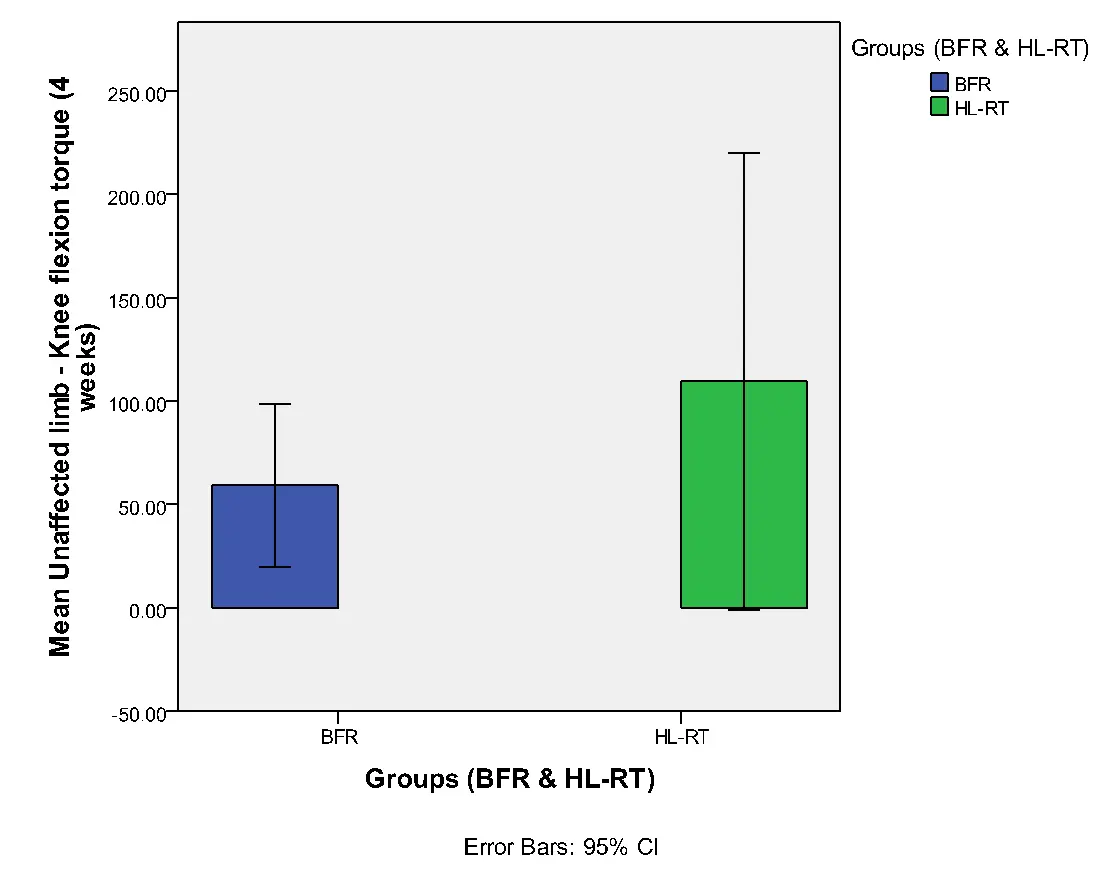
It was evident that the average torque values (flexion/ extension) of injured and uninjured limbs after 4 weeks was higher in HL-RT group than BFR.
The comparison of the muscle pain affected and unaffected shows that there was a significant difference between the muscle pain between affected and unaffected group as the sig. values of the t-test for equality of means was less than 0.05. Similarly, the comparison of the ankle pain affected and after 24 hour shows an insignificant difference between the ankle pain levels across the 7 sessions as its sig. value was greater than 0.05. Also the comparison of the muscle pain affected and after 24 hour shows an insignificant difference between the muscle pain levels across the 7 sessions as its sig. value of the t-test for equality of means was greater than 0.05.
T-Test (Comparison of injured limb between BFR and HL-RT – Torque 60/s)
| Group Statistics | |||||
|---|---|---|---|---|---|
| Groups (BFR & HL-RT) | N | Mean | Std. Deviation | Std. Error Mean | |
| Injured limb – Knee extension torque (Pre) | BFR | 4 | 95.7875 | 47.03110 | 23.51555 |
| HL-RT | 2 | 178.7500 | 39.66869 | 28.05000 | |
| Injured limb – Knee extension torque (4 weeks) | BFR | 4 | 120.2500 | 44.57626 | 22.28813 |
| HL-RT | 2 | 211.0000 | 42.85067 | 30.30000 | |
| Injured limb – Knee flexion torque (Pre) | BFR | 4 | 56.4500 | 23.22994 | 11.61497 |
| HL-RT | 2 | 84.5500 | 6.01041 | 4.25000 | |
| Injured limb – Knee flexion torque (4 weeks) | BFR | 4 | 59.3000 | 20.14944 | 10.07472 |
| HL-RT | 2 | 100.4000 | 7.07107 | 5.00000 | |
| Independent Samples Test | ||||||||||
|---|---|---|---|---|---|---|---|---|---|---|
| Levene’s Test for Equality of Variances | t-test for Equality of Means | |||||||||
| 95% Confidence Interval of the Difference | ||||||||||
| F | Sig. | t | df | Sig. (2-tailed) | Mean Difference | Std. Error Difference | Lower | Upper | ||
| Injured limb – Knee extension torque (Pre) | Equal variances assumed | .610 | .478 | -2.115 | 4 | .102 | -82.96250 | 39.23338 | -191.89183 | 25.96683 |
| Equal variances not assumed | -2.267 | 2.490 | .126 | -82.96250 | 36.60305 | -214.19508 | 48.27008 | |||
| Injured limb – Knee extension torque (4 weeks) | Equal variances assumed | .200 | .678 | -2.373 | 4 | .077 | -90.75000 | 38.23605 | -196.91030 | 15.41030 |
| Equal variances not assumed | -2.413 | 2.164 | .128 | -90.75000 | 37.61450 | -241.40229 | 59.90229 | |||
| Injured limb – Knee flexion torque (Pre) | Equal variances assumed | 21.851 | .009 | -1.595 | 4 | .186 | -28.10000 | 17.61577 | -77.00922 | 20.80922 |
| Equal variances not assumed | -2.272 | 3.660 | .092 | -28.10000 | 12.36810 | -63.73364 | 7.53364 | |||
| Injured limb – Knee flexion torque (4 weeks) | Equal variances assumed | 1.584 | .277 | -2.666 | 4 | .056 | -41.10000 | 15.41914 | -83.91041 | 1.71041 |
| Equal variances not assumed | -3.654 | 3.942 | .022 | -41.10000 | 11.24722 | -72.50827 | -9.69173 | |||
T-Test (Comparison of injured limb between BFR and HL-RT – Torque 150/s)
| Group Statistics | |||||
| Groups (BFR & HL-RT) | N | Mean | Std. Deviation | Std. Error Mean | |
| Injured limb – Knee extension torque (Pre) | BFR | 4 | 59.7250 | 32.34114 | 16.17057 |
| HL-RT | 2 | 131.0500 | 38.11306 | 26.95000 | |
| Injured limb – Knee extension torque (4 weeks) | BFR | 4 | 80.1250 | 33.81286 | 16.90643 |
| HL-RT | 2 | 139.5000 | 23.19310 | 16.40000 | |
| Injured limb – Knee flexion torque (Pre) | BFR | 4 | 37.4750 | 25.15278 | 12.57639 |
| HL-RT | 2 | 70.8000 | 11.87939 | 8.40000 | |
| Injured limb – Knee flexion torque (4 weeks) | BFR | 4 | 45.5000 | 7.27599 | 3.63799 |
| HL-RT | 2 | 89.0500 | 1.06066 | .75000 | |
| Independent Samples Test | ||||||||||
|---|---|---|---|---|---|---|---|---|---|---|
| Levene’s Test for Equality of Variances | t-test for Equality of Means | |||||||||
| 95% Confidence Interval of the Difference | ||||||||||
| F | Sig. | t | df | Sig. (2-tailed) | Mean Difference | Std. Error Difference | Lower | Upper | ||
| Injured limb – Knee extension torque (Pre) | Equal variances assumed | .109 | .758 | -2.431 | 4 | .072 | -71.32500 | 29.33786 | -152.77995 | 10.12995 |
| Equal variances not assumed | -2.269 | 1.773 | .167 | -71.32500 | 31.42912 | -224.57261 | 81.92261 | |||
| Injured limb – Knee extension torque (4 weeks) | Equal variances assumed | .462 | .534 | -2.177 | 4 | .095 | -59.37500 | 27.27584 | -135.10487 | 16.35487 |
| Equal variances not assumed | -2.521 | 3.091 | .084 | -59.37500 | 23.55392 | -133.09939 | 14.34939 | |||
| Injured limb – Knee flexion torque (Pre) | Equal variances assumed | 1.620 | .272 | -1.704 | 4 | .164 | -33.32500 | 19.55333 | -87.61374 | 20.96374 |
| Equal variances not assumed | -2.203 | 3.928 | .094 | -33.32500 | 15.12368 | -75.61896 | 8.96896 | |||
| Injured limb – Knee flexion torque (4 weeks) | Equal variances assumed | 3.758 | .125 | -7.952 | 4 | .001 | -43.55000 | 5.47628 | -58.75460 | -28.34540 |
| Equal variances not assumed | -11.724 | 3.243 | .001 | -43.55000 | 3.71450 | -54.88582 | -32.21418 | |||
T-Test (Comparison of injured limb between BFR and HL-RT – Torque 300/s)
| Group Statistics | |||||
|---|---|---|---|---|---|
| Groups (BFR & HL-RT) | N | Mean | Std. Deviation | Std. Error Mean | |
| Injured limb – Knee extension torque (Pre) | BFR | 4 | 68.8250 | 29.70807 | 14.85403 |
| HL-RT | 2 | 100.1000 | 20.08183 | 14.20000 | |
| Injured limb – Knee extension torque (4 weeks) | BFR | 4 | 72.0750 | 27.48786 | 13.74393 |
| HL-RT | 2 | 96.9000 | 16.54630 | 11.70000 | |
| Injured limb – Knee flexion torque (Pre) | BFR | 4 | 47.5000 | 19.88752 | 9.94376 |
| HL-RT | 2 | 61.7000 | 7.63675 | 5.40000 | |
| Injured limb – Knee flexion torque (4 weeks) | BFR | 4 | 53.5750 | 13.89637 | 6.94819 |
| HL-RT | 2 | 72.3500 | 4.31335 | 3.05000 | |
| Independent Samples Test | ||||||||||
|---|---|---|---|---|---|---|---|---|---|---|
| Levene’s Test for Equality of Variances | t-test for Equality of Means | |||||||||
| 95% Confidence Interval of the Difference | ||||||||||
| F | Sig. | t | df | Sig. (2-tailed) | Mean Difference | Std. Error Difference | Lower | Upper | ||
| Injured limb – Knee extension torque (Pre) | Equal variances assumed | .914 | .393 | -1.308 | 4 | .261 | -31.27500 | 23.91778 | -97.68140 | 35.13140 |
| Equal variances not assumed | -1.522 | 3.135 | .222 | -31.27500 | 20.54951 | -95.11119 | 32.56119 | |||
| Injured limb – Knee extension torque (4 weeks) | Equal variances assumed | 17.240 | .014 | -1.137 | 4 | .319 | -24.82500 | 21.82542 | -85.42208 | 35.77208 |
| Equal variances not assumed | -1.375 | 3.465 | .251 | -24.82500 | 18.04953 | -78.14413 | 28.49413 | |||
| Injured limb – Knee flexion torque (Pre) | Equal variances assumed | 43.200 | .003 | -.929 | 4 | .405 | -14.20000 | 15.27780 | -56.61798 | 28.21798 |
| Equal variances not assumed | -1.255 | 3.989 | .278 | -14.20000 | 11.31540 | -45.64935 | 17.24935 | |||
| Injured limb – Knee flexion torque (4 weeks) | Equal variances assumed | 1.267 | .323 | -1.773 | 4 | .151 | -18.77500 | 10.58831 | -48.17287 | 10.62287 |
| Equal variances not assumed | -2.474 | 3.840 | .071 | -18.77500 | 7.58813 | -40.19423 | 2.64423 | |||
T-Test (Comparison of uninjured limb between BFR and HL-RT – Torque 60/s)
| Group Statistics | |||||
|---|---|---|---|---|---|
| Groups (BFR & HL-RT) | N | Mean | Std. Deviation | Std. Error Mean | |
| Unaffected limb – Knee extension torque (Pre) | BFR | 3 | 148.4333 | 40.91960 | 23.62494 |
| HL-RT | 2 | 271.8500 | 26.51650 | 18.75000 | |
| Unaffected limb – Knee extension torque (4 weeks) | BFR | 3 | 156.1333 | 64.85263 | 37.44268 |
| HL-RT | 2 | 272.3500 | 36.41600 | 25.75000 | |
| Unaffected limb – Knee flexion torque (Pre) | BFR | 3 | 71.9000 | 23.85142 | 13.77062 |
| HL-RT | 2 | 132.6500 | 2.05061 | 1.45000 | |
| Unaffected limb – Knee flexion torque (4 weeks) | BFR | 3 | 59.7000 | 3.75100 | 2.16564 |
| HL-RT | 2 | 127.4500 | 28.21356 | 19.95000 | |
| Independent Samples Test | ||||||||||
|---|---|---|---|---|---|---|---|---|---|---|
| Levene’s Test for Equality of Variances | t-test for Equality of Means | |||||||||
| 95% Confidence Interval of the Difference | ||||||||||
| F | Sig. | t | df | Sig. (2-tailed) | Mean Difference | Std. Error Difference | Lower | Upper | ||
| Unaffected limb – Knee extension torque (Pre) | Equal variances assumed | 1.453 | .314 | -3.679 | 3 | .035 | -123.41667 | 33.54910 | -230.18488 | -16.64846 |
| Equal variances not assumed | -4.092 | 2.962 | .027 | -123.41667 | 30.16124 | -220.09656 | -26.73677 | |||
| Unaffected limb – Knee extension torque (4 weeks) | Equal variances assumed | 2.181 | .236 | -2.235 | 3 | .112 | -116.21667 | 52.00922 | -281.73321 | 49.29988 |
| Equal variances not assumed | -2.557 | 2.998 | .083 | -116.21667 | 45.44246 | -260.89002 | 28.45669 | |||
| Unaffected limb – Knee flexion torque (Pre) | Equal variances assumed | 7.011 | .077 | -3.411 | 3 | .042 | -60.75000 | 17.81062 | -117.43133 | -4.06867 |
| Equal variances not assumed | -4.387 | 2.044 | .046 | -60.75000 | 13.84675 | -119.11301 | -2.38699 | |||
| Unaffected limb – Knee flexion torque (4 weeks) | Equal variances assumed | 122.884 | .002 | -4.478 | 3 | .021 | -67.75000 | 15.13041 | -115.90170 | -19.59830 |
| Equal variances not assumed | -3.376 | 1.024 | .179 | -67.75000 | 20.06720 | -309.22772 | 173.72772 | |||
T-Test (Comparison of uninjured limb between BFR and HL-RT – Torque 150/s)
| Group Statistics | |||||
|---|---|---|---|---|---|
| Groups (BFR & HL-RT) | N | Mean | Std. Deviation | Std. Error Mean | |
| Unaffected limb – Knee extension torque (Pre) | BFR | 3 | 106.1667 | 26.98747 | 15.58122 |
| HL-RT | 2 | 181.7000 | 9.19239 | 6.50000 | |
| Unaffected limb – Knee extension torque (4 weeks) | BFR | 3 | 119.8000 | 51.50689 | 29.73752 |
| HL-RT | 2 | 188.2500 | 25.52655 | 18.05000 | |
| Unaffected limb – Knee flexion torque (Pre) | BFR | 3 | 59.5667 | 24.87757 | 14.36307 |
| HL-RT | 2 | 101.1000 | 9.89949 | 7.00000 | |
| Unaffected limb – Knee flexion torque (4 weeks) | BFR | 3 | 59.3000 | 15.90566 | 9.18314 |
| HL-RT | 2 | 109.5000 | 12.30366 | 8.70000 | |
| Independent Samples Test | ||||||||||
|---|---|---|---|---|---|---|---|---|---|---|
| Levene’s Test for Equality of Variances | t-test for Equality of Means | |||||||||
| 95% Confidence Interval of the Difference | ||||||||||
| F | Sig. | t | df | Sig. (2-tailed) | Mean Difference | Std. Error Difference | Lower | Upper | ||
| Unaffected limb – Knee extension torque (Pre) | Equal variances assumed | 1.570 | .299 | -3.651 | 3 | .035 | -75.53333 | 20.69049 | -141.37970 | -9.68697 |
| Equal variances not assumed | -4.474 | 2.599 | .028 | -75.53333 | 16.88267 | -134.26588 | -16.80079 | |||
| Unaffected limb – Knee extension torque (4 weeks) | Equal variances assumed | 1.865 | .265 | -1.683 | 3 | .191 | -68.45000 | 40.68007 | -197.91214 | 61.01214 |
| Equal variances not assumed | -1.968 | 2.946 | .145 | -68.45000 | 34.78682 | -180.32431 | 43.42431 | |||
| Unaffected limb – Knee flexion torque (Pre) | Equal variances assumed | 3.039 | .180 | -2.156 | 3 | .120 | -41.53333 | 19.26271 | -102.83586 | 19.76919 |
| Equal variances not assumed | -2.599 | 2.752 | .088 | -41.53333 | 15.97804 | -95.07140 | 12.00473 | |||
| Unaffected limb – Knee flexion torque (4 weeks) | Equal variances assumed | .742 | .452 | -3.715 | 3 | .034 | -50.20000 | 13.51296 | -93.20426 | -7.19574 |
| Equal variances not assumed | -3.968 | 2.758 | .033 | -50.20000 | 12.64990 | -92.53265 | -7.86735 | |||
T-Test (Comparison of uninjured limb between BFR and HL-RT – Torque 300/s)
| Group Statistics | |||||
|---|---|---|---|---|---|
| Groups (BFR & HL-RT) | N | Mean | Std. Deviation | Std. Error Mean | |
| Unaffected limb – Knee extension torque (Pre) | BFR | 3 | 79.2000 | 24.11866 | 13.92492 |
| HL-RT | 2 | 137.5500 | 34.86036 | 24.65000 | |
| Unaffected limb – Knee extension torque (4 weeks) | BFR | 3 | 81.8333 | 35.30784 | 20.38499 |
| HL-RT | 2 | 124.5500 | 6.85894 | 4.85000 | |
| Unaffected limb – Knee flexion torque (Pre) | BFR | 3 | 50.2333 | 14.00940 | 8.08833 |
| HL-RT | 2 | 69.9000 | 10.46518 | 7.40000 | |
| Unaffected limb – Knee flexion torque (4 weeks) | BFR | 3 | 59.0000 | 21.76396 | 12.56543 |
| HL-RT | 2 | 79.3500 | 12.37437 | 8.75000 | |
| Independent Samples Test | ||||||||||
|---|---|---|---|---|---|---|---|---|---|---|
| Levene’s Test for Equality of Variances | t-test for Equality of Means | |||||||||
| 95% Confidence Interval of the Difference | ||||||||||
| F | Sig. | t | df | Sig. (2-tailed) | Mean Difference | Std. Error Difference | Lower | Upper | ||
| Unaffected limb – Knee extension torque (Pre) | Equal variances assumed | .698 | .465 | -2.270 | 3 | .108 | -58.35000 | 25.70487 | -140.15436 | 23.45436 |
| Equal variances not assumed | -2.061 | 1.656 | .201 | -58.35000 | 28.31123 | -207.96228 | 91.26228 | |||
| Unaffected limb – Knee extension torque (4 weeks) | Equal variances assumed | 3.071 | .178 | -1.608 | 3 | .206 | -42.71667 | 26.56403 | -127.25527 | 41.82193 |
| Equal variances not assumed | -2.039 | 2.219 | .166 | -42.71667 | 20.95400 | -124.87411 | 39.44077 | |||
| Unaffected limb – Knee flexion torque (Pre) | Equal variances assumed | .720 | .458 | -1.665 | 3 | .194 | -19.66667 | 11.80921 | -57.24884 | 17.91551 |
| Equal variances not assumed | -1.794 | 2.811 | .177 | -19.66667 | 10.96271 | -55.92202 | 16.58869 | |||
| Unaffected limb – Knee flexion torque (4 weeks) | Equal variances assumed | 1.249 | .345 | -1.164 | 3 | .329 | -20.35000 | 17.48384 | -75.99139 | 35.29139 |
| Equal variances not assumed | -1.329 | 2.999 | .276 | -20.35000 | 15.31184 | -69.08481 | 28.38481 | |||
T-Test (Comparison of muscle pain levels – affected and unaffected)
| Group Statistics | |||||
|---|---|---|---|---|---|
| Muscle Pain Group (affected and unaffected) | N | Mean | Std. Deviation | Std. Error Mean | |
| Muscle pain Affected and unaffected | Muscle pain affected | 14 | 4.7000 | .41324 | .11044 |
| Muscle pain unaffected | 14 | 5.4571 | .85099 | .22744 | |
| Independent Samples Test | ||||||||||
|---|---|---|---|---|---|---|---|---|---|---|
| Levene’s Test for Equality of Variances | t-test for Equality of Means | |||||||||
| 95% Confidence Interval of the Difference | ||||||||||
| F | Sig. | t | df | Sig. (2-tailed) | Mean Difference | Std. Error Difference | Lower | Upper | ||
| Muscle pain Affected and unaffected | Equal variances assumed | 7.420 | .011 | -2.995 | 26 | .006 | -.75714 | .25283 | -1.27685 | -.23744 |
| Equal variances not assumed | -2.995 | 18.808 | .008 | -.75714 | .25283 | -1.28669 | -.22759 | |||
T-Test (Comparison of Ankle Pain Affected and 24Hr hour)
| Group Statistics | |||||
|---|---|---|---|---|---|
| Ankle Pain Group | N | Mean | Std. Deviation | Std. Error Mean | |
| Ankle Pain Affected and 24Hr hour levels | Ankle pain | 14 | 2.0786 | .59119 | .15800 |
| Ankle pain (24hr) | 14 | 1.7786 | .58465 | .15625 | |
| Independent Samples Test | ||||||||||
|---|---|---|---|---|---|---|---|---|---|---|
| Levene’s Test for Equality of Variances | t-test for Equality of Means | |||||||||
| 95% Confidence Interval of the Difference | ||||||||||
| F | Sig. | t | df | Sig. (2-tailed) | Mean Difference | Std. Error Difference | Lower | Upper | ||
| Ankle Pain Affected and 24Hr hour levels | Equal variances assumed | .063 | .804 | 1.350 | 26 | .189 | .30000 | .22222 | -.15677 | .75677 |
| Equal variances not assumed | 1.350 | 25.997 | .189 | .30000 | .22222 | -.15677 | .75677 | |||
T-Test (Comparison of Muscle Pain Affected and 24Hr hour)
| Group Statistics | |||||
|---|---|---|---|---|---|
| Muscle Pain Group (Muscle pain affected and 24 hr levels) | N | Mean | Std. Deviation | Std. Error Mean | |
| Muscle Pain Affected and 24Hr hour levels | Muscle pain affected | 14 | 1.7786 | .58465 | .15625 |
| Muscle Pain (24hr) | 14 | 1.4114 | .75201 | .20098 | |
| Independent Samples Test | ||||||||||
|---|---|---|---|---|---|---|---|---|---|---|
| Levene’s Test for Equality of Variances | t-test for Equality of Means | |||||||||
| 95% Confidence Interval of the Difference | ||||||||||
| F | Sig. | t | df | Sig. (2-tailed) | Mean Difference | Std. Error Difference | Lower | Upper | ||
| Muscle Pain Affected and 24Hr hour levels | Equal variances assumed | .683 | .416 | 1.442 | 26 | .161 | .36714 | .25458 | -.15615 | .89043 |
| Equal variances not assumed | 1.442 | 24.510 | .162 | .36714 | .25458 | -.15770 | .89199 | |||
The analysis compared the average torque values (flexion/extension) in injured and uninjured limbs between BFR and HL-RT groups at pre and 4-week timelines at various testing speeds (60, 150, 300 degrees per second).
You May Also Like

All work is written by human writers. 100% AI free, guaranteed.

100% money back guarantee if you find plagiarism in our work.
COMPANY DETAILS


