Here is a sample that showcases why we are one of the world’s leading academic writing firms. This assignment was created by one of our expert academic writers and demonstrated the highest academic quality. Place your order today to achieve academic greatness.
Table of Contents
The quantitative analysis of the questionnaire-based survey data was performed using frequency distribution analysis. The results in the form of pie charts are given and discussed below. However, the frequency distribution result tables are given in the Appendices section. Based on the analysis, it was possible to identify the reasons for getting a dog during the lockdown in the UK. There were two demographic questions focused on identifying the gender and age group of the majority of the participants, as shown below in Figures 1 and 2.
Figure 1
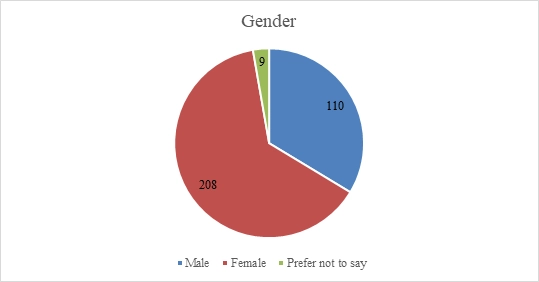
Figure 2
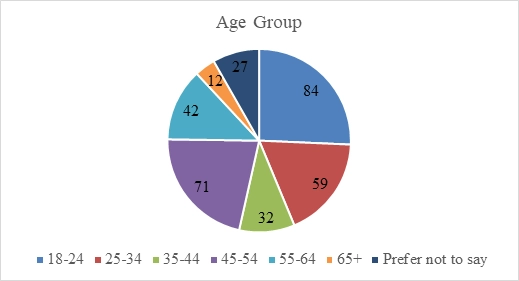
As per the results, the majority of the participants of this survey were female. Moreover, most people were between 18 to 24 years of age, whereas the least number of people who were 65+ years of age participated in this study. Hence, the majority of the participants were youngsters.
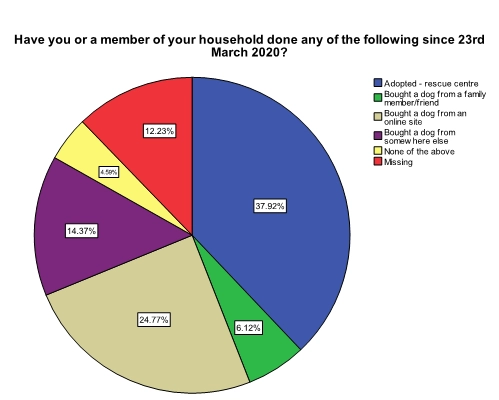
Moreover, the respondents were asked if, since March 23rd 2020, any of their household members have adopted a dog or bought one from a family member/friend, an online site, or elsewhere. The results shown below in figure 3 that most respondents had adopted a dog from a rescue centre or bought a dog from an online site.
Figure 3
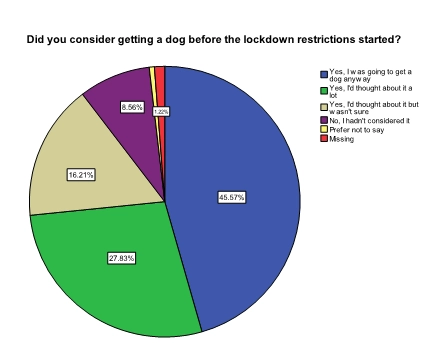
The next question asked the respondents if they considered getting a dog before the lockdown restrictions started. The results in figure 4 show that most respondents stated, ‘Yes, I was going to get a god anyway’.
Figure 4
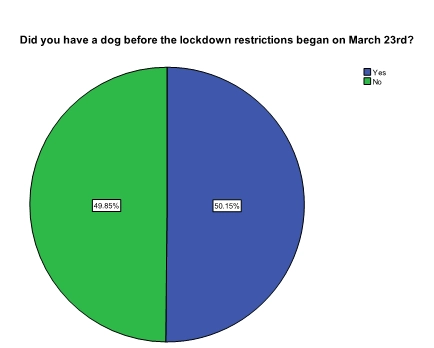
When the respondents were asked if they had a dog before the lockdown restrictions began on March 23rd, it was found that around half of the participants already had a dog before the lockdown restrictions began on March 23rd, as shown below in figure 5.
Figure 5
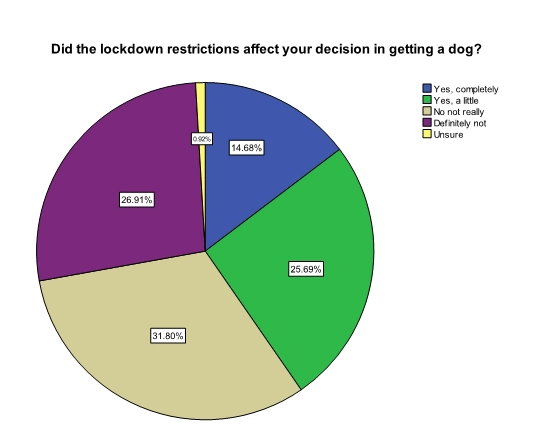
Afterwards, the respondents were asked if the lockdown restrictions affected their decision to get a dog. The results shown below in figure 6 indicate that most of the respondent’s decision was affected by the lockdown restrictions.
Figure 6
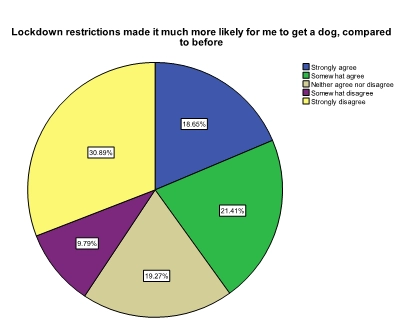
The respondents were then asked how much they agreed that lockdown restrictions made it much more likely for me to get a dog, compared to before. The results shown below in figure 7 indicate that around half of the respondents agreed while the remaining half disagreed that lockdown restrictions made it much more likely for me to get a dog compared to before. So this shows that lockdown restrictions did not impact people getting a dog, compared to before.
Figure 6
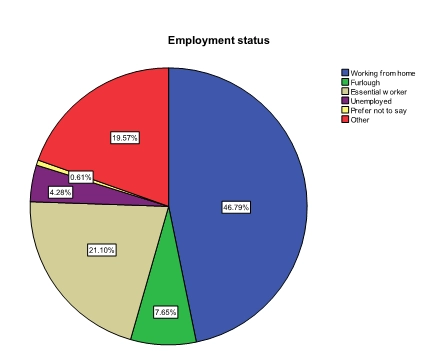
The results given in figure 7 show the majority of the participants who adopted a dog were working from home.
Figure 7
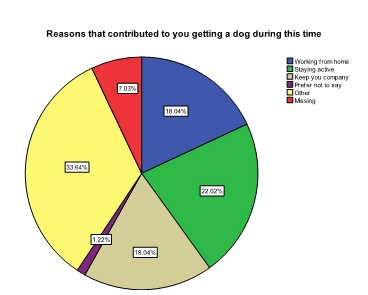
As per the results given in figure 8, for most participants staying active, working from home, and keeping themselves company were the three main reasons that contributed to them getting a dog during the lockdown.
Figure 8
Professional editors proofread and edit your paper by focusing on:

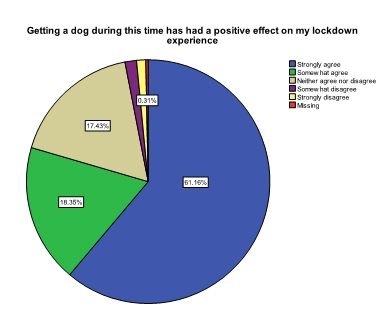
The results shown below in figure 9 shows that most participants strongly agreed that getting a dog during this time has had a positive effect on their lockdown experience.
Figure 9
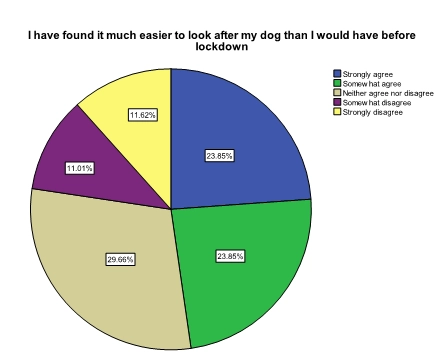
Moreover, the results given below in figure 10 shows that most of the participants strongly agreed or somewhat agreed that they have found it much easier to look after their dogs than before the lockdown.
Figure 10
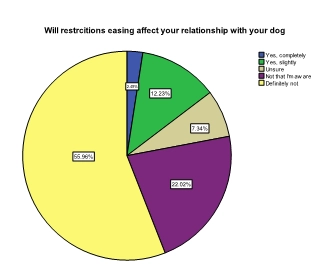
The results shown in figure 11 depict that most participants did not agree that as the situation returns to normal, restrictions will easing affect their relationship with their dog so because the majority of the participant’s relationships will not be affected even after the lockdown is ended.
Figure 11
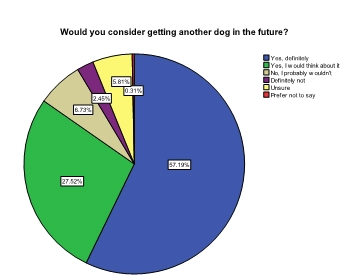
When the respondents were asked if they would consider getting another dog in the future, most of them stated ‘Yes, definitely’ or ‘Yes, I would think about it’. This shows that most participants will be willing to get another dog in the future.
Figure 12
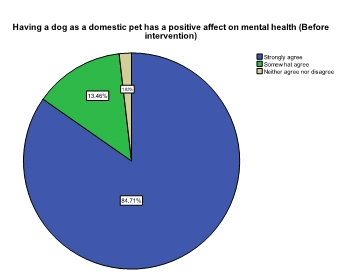
The results shown below in figure 13 indicate that before the intervention when the participants were asked to have a dog as a domestic pet positively impacted their mental health. The majority of the participants strongly agreed that having a dog as a domestic pet positively impacts mental health.
Figure 13
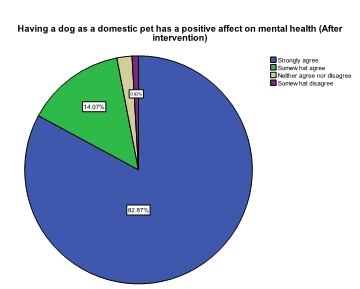
However, after the intervention, when the participants were asked whether having a dog as a domestic pet has a positive impact on mental health. Most of the participants still strongly agreed that having a dog as a domestic pet positively impacts mental health, as shown below in figure 14.
Figure 14
1. Define the research question and hypothesis.
2. Collect relevant data from biological experiments or observations.
3. Clean and organize the data.
4. Choose appropriate statistical tests based on data type and research design.
5. Conduct the statistical analysis using software or programming.
6. Interpret the results and draw conclusions and Communicate findings through a report.
You May Also Like
All work is written by human writers. 100% AI free, guaranteed.
100% money back guarantee if you find plagiarism in our work.
COMPANY DETAILS


