Here is a sample that showcases why we are one of the world’s leading academic writing firms. This assignment was created by one of our expert academic writers and demonstrated the highest academic quality. Place your order today to achieve academic greatness.
Table of Contents
The impact of advanced nurse practitioner (ANP) and clinician’s care on treatment in emergency settings is carried out in the study. The data is gathered through a primary source involving 67 paediatric patients. Statistical tools were used to analyse the association between the impact of clinicians, duration of stay at the hospital, readmission and review from the patients. There was no significant association found in any variable except for the integrated clinical pathway to clinicians, the length of stay duration in hospital and clinicians also showed significant association.
This chapter presents the findings and analysis of the topic ‘impact of Paediatrics advanced nurse practitioner-led care on the acute management of children diagnosed with viral-induced wheeze or bronchiolitis’. Moreover, the findings also examine the performance of ANP against national ED clinical quality indicators as compared to doctors when managing children and young people. The data analysis has been conducted concerning the description provided in the previous chapter. In this concern, the undertaken sample is 67 participants who were all children aged from three months to five years. The data was gathered via primary means with the use of a survey questionnaire. Additionally, the following chapter includes frequency analysis in the first section whereas, in the second section, the regression analysis is conducted. Furthermore, univariate testing has been further done to assess the impact of ANP against ED for paediatrics care. Lastly, the discussion has been presented with respect to the findings of this study and past studies.
The purpose of conducting frequency analysis is to comprehend the sample by analysing the respondent’s responses against the set of questions asked. In this section, the frequency of different patients with different symptoms is analysed with respect to their percentage of complaints. Most of the patients were complaining about DIB symptoms with 62.69%.
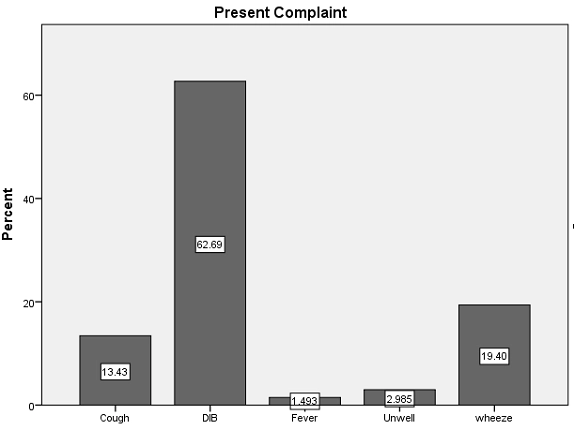
Figure 1: Complaints of patients according to the symptoms which they feel
From the analysis of data after diagnosis of patients in the figure below, it is identified that compare to the bronchiolitis, more patients were diagnosed with viral-induced wheeze having a frequency percentage of 56.72.
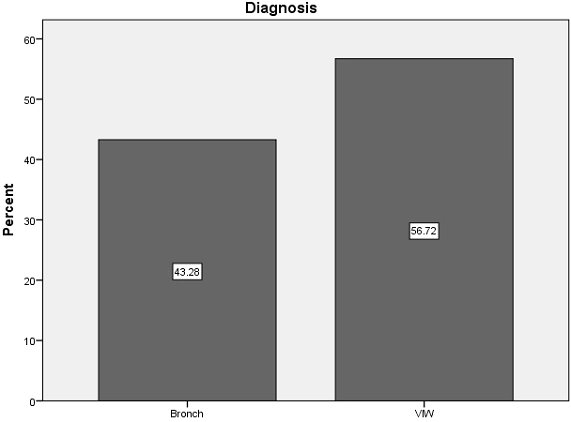
Figure 2: Graphical representation of diagnosis of the diseases
The frequency of doctors is higher which is 68.66 while the frequency of nurses is lower. This means that the sample used in this study has a greater number of doctors understudy as compared to the number of nurses.
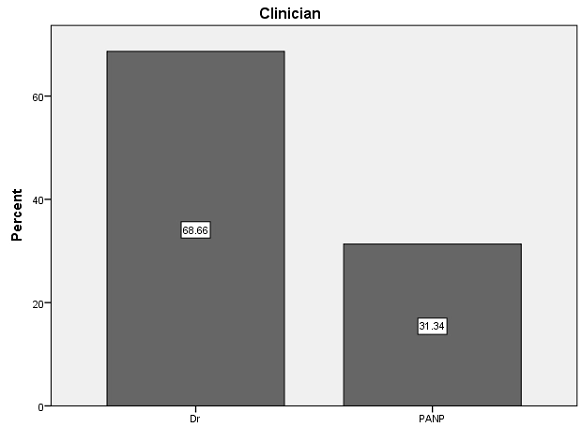
Figure 3 Graphical representation of diagnosis of the number of clinicians
After examination of the patients, 52.4% of the patients were discharged and sent to their homes while 26.87% of patients fall under the category of PAU and 20.90% of patients were admitted to the ward.
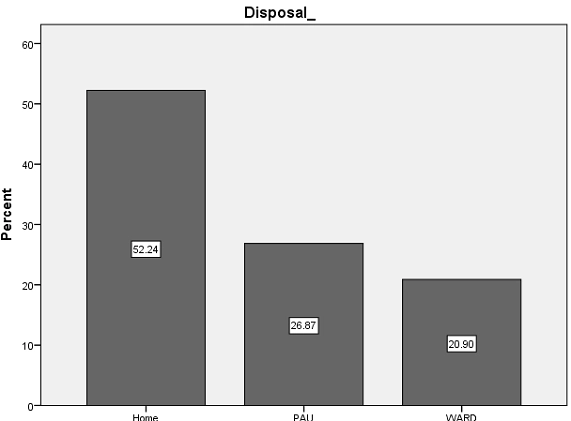
Figure 4 Graphical representation of diagnosis of the percentage of disposals
The frequency of readmissions within 7 days was very low with only 5.97% of patients being readmitted after discharge.
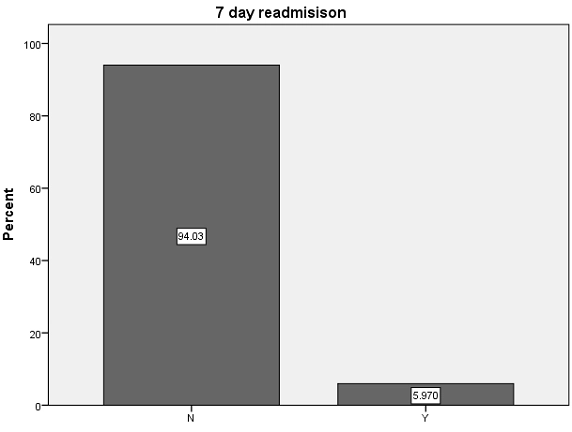
Figure 5 Graphical representation of diagnosis of the number of readmissions
The below figure illustrates that 73.68% responded no with regards to the use of ICP for the wheeze while only 26.32% supported the use of ICP for wheeze.
Professional editors proofread and edit your paper by focusing on:

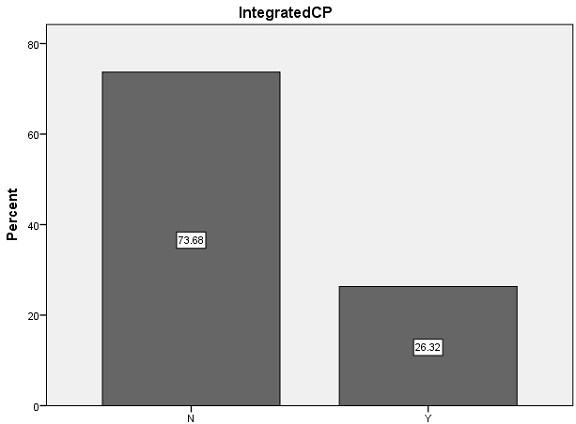
Figure 6 Graphical representation of diagnosis of disease using ICP
Bronchiolitis patients, according to priority for treatment, are divided into 3 categories among which only 10.45% fall in the category of very urgent (orange), 22.33% fall in the category of standard (green) while 67.16% of patients were referred as urgent patients (yellow).
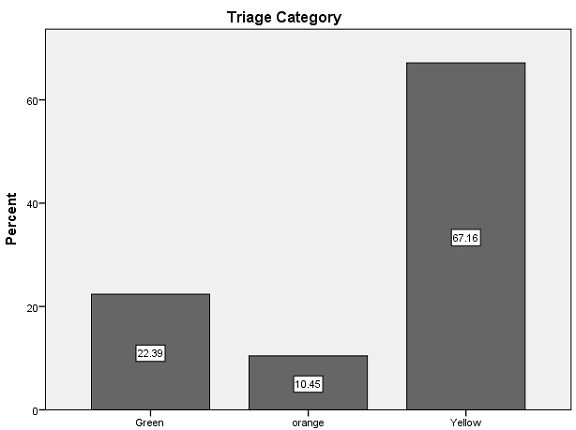
Figure 7 Graphical representation of diagnosis of the number of Triage category
The following section provides the descriptive statistical analysis of the data consisting of measures of central tendency and dispersion.
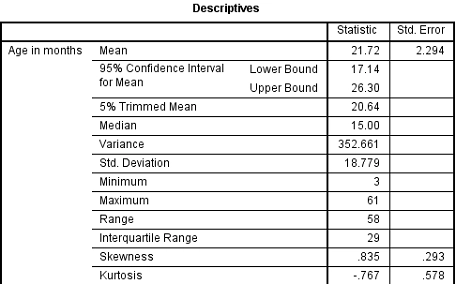
21 months is the mean age of children which denotes that on average, the patients are 21 months old and the median value is 15, which is the middlemost value of the dataset. The second value to be considered is IQR which is the Q3-Q1 of the data set representing the values between the 25th and 7th observation. In the interquartile range, the value is 29.
Table 1 Descriptive summary of the age of patients in a month
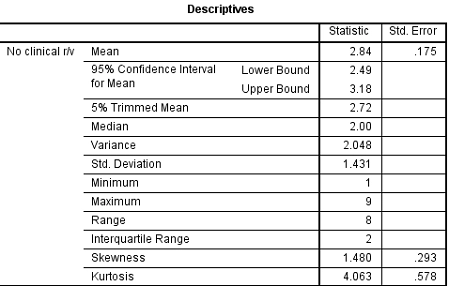
The average clinical review within the hospital is 2.84, with a median of 2. The deviation from the mean value is 1.431 indicating that values are scattered at +1.431 and -1.431 from the mean. The interquartile range for a number of clinical reviews is 2.
Table 2 Descriptive summary of clinical reviews
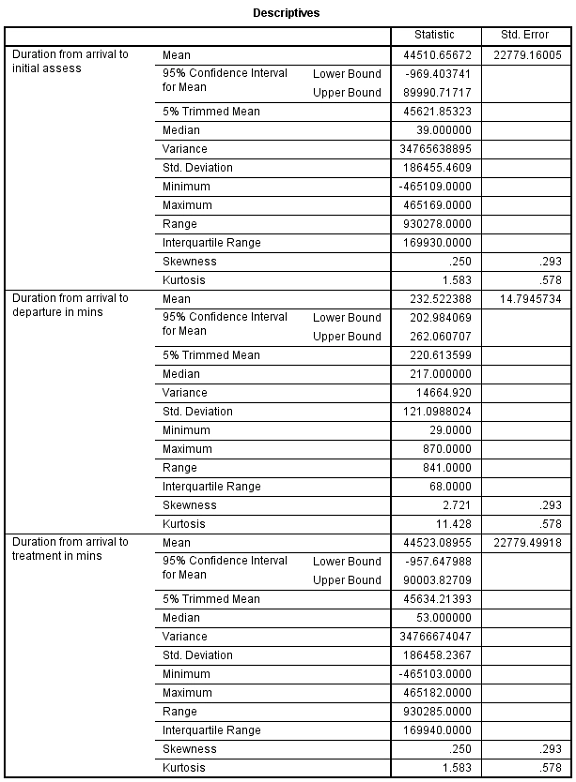
For the duration from arrival to initial assessments, the average value is 44510 with a median of 39. The interquartile range is 169930 indicating that most values fall within this range. It deviated from the mean point with a value of 186445 denoted through standard deviation.
The duration from arrival to departure in minutes has an average value of 232.522 with a median of 217. The interquartile range is 169930 which is between the 25th to 75th data value the standard deviation that is a deviation from the mean point is 121.
For the duration from arrival to treatment, the average value is 44523 and the median is 53 while the interquartile range is 169940. Moreover, the standard deviation from the mean value is 18645588.
Table 3 Descriptive summary of arrival and departure of patients
The following section illustrates the outcomes of the Chi-Square test conducted to test the association between two variables. The test is conducted on a different set of variables which have been explained in detail below. The results can be viewed as follows:
Table 4 Association of readmission with clinicians
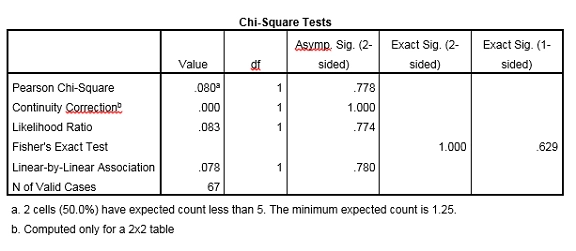
The values to be considered in the above table are Pearson’s Chi-Square and the significance value for the 2-tailed test. The significance value is also known as the p-value or probability value in statistical terms. Considering the benchmarks for the aforementioned values, the alternate hypothesis that readmission in 7 days is insignificantly associated with clinicians is rejected. The inference has been made because the p-value is 0.778 in this case which ideally should be less than 0.05 for the acceptance of the hypothesis. The other tests used such as Fisher’s Exact test also reject the hypothesis because the significance or p-value is greater than 0.05 having a value of 0.629.
Table 5 Association of ICP with clinicians
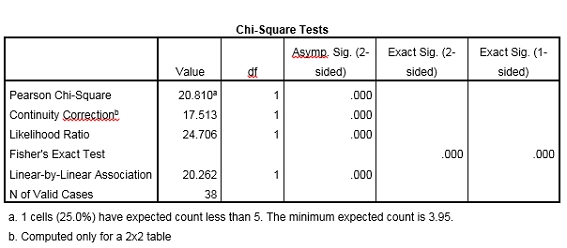
Similar to the previous table, the values under consideration are Pearson Chi-Square and sig. The alternative hypothesis showing the association between integrated CP (ICP) and clinicians is accepted. The reason is that the significance value stands at 0.000 which is much lesser than the acceptable threshold of 0.05. The other tests used such as Fisher’s exact test also show the significance of association with a sig value of 0.000 indicating that the null hypothesis has been rejected. Thus, a wheeze integrated care pathway used for patients needed less recovery time. The strength of association is also high at 20 showing a strong link between the two variables studied.
Table 6 Association of clinicians with diagnosis
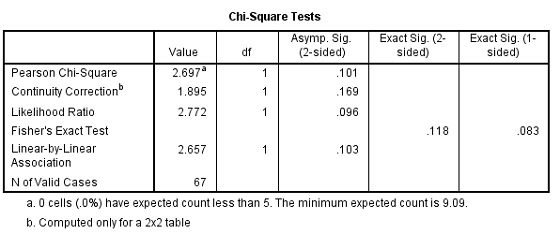
In this case, the alternative hypothesis associating diagnosis with clinicians is rejected. This is because of p-value is higher than 0.05. Fisher’s Exact Test also shows the rejection of alternative hypotheses since the Exact Sig. value is higher than the acceptable level of 0.05 for the association to be significant. Thus, it is deduced from the results that clinicians do not affect the diagnosis of wheeze and bronchitis patients.
Table 7 Association of Clinicians and clinicians review
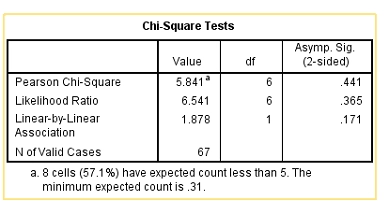
The Pearson chi-square test executed for the variable to test the association between clinicians and clinical reviews has been rejected due to the significant value being 0.441 higher than the threshold of 0.05 Thus, it can be inferred that there is no association between the clinicians and total reviews given by them on the diagnosis of disease.
Table 8 Association of ED duration with the initial assessment
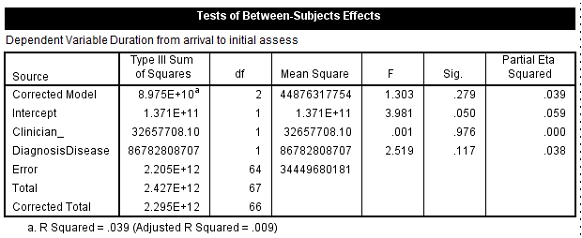
The Univariate test rejects the alternative hypothesis of duration from arrival to departure time for clinicians and diagnosis of disease. Thus, the initial time assessment is independent of the subjects involved in the diagnosis. The given table above illustrates the difference between the duration of assessment time for clinicians and ANPs. No significant difference is seen in the graph below so the alternative hypothesis has been rejected.
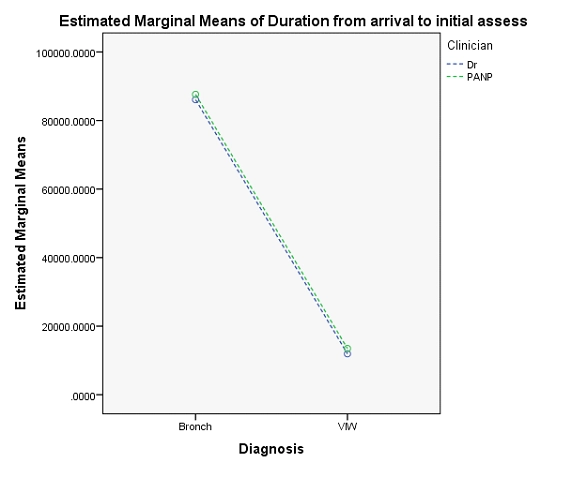
Figure 9 Duration from arrival to initial assess
Table 9 Association between arrivals to the treatment of patients
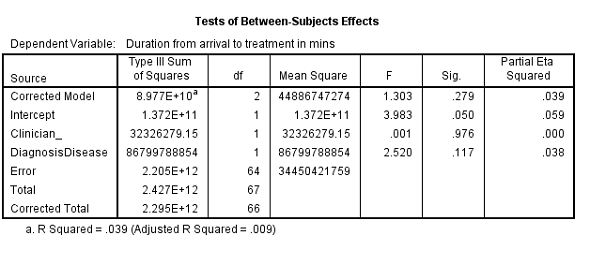
The Univariate test rejects the alternate hypothesis of duration from arrival to treatment time for clinicians and diagnosis of disease. Thus, it can be deduced that the treatment length is independent of the subjects involved in the diagnosis. Below given graph clearly illustrates the insignificant difference in duration of diagnosis of anticipated disease and clinicians.
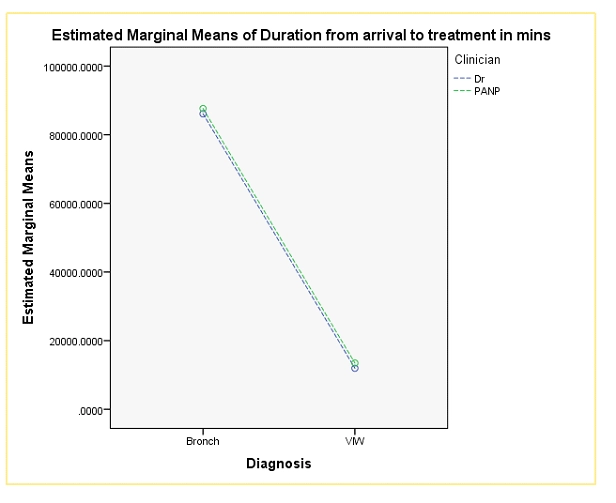
Figure 10 Graphical representation of duration from arrival to treatment
Table 10 Association between arrivals to departure time with clinicians
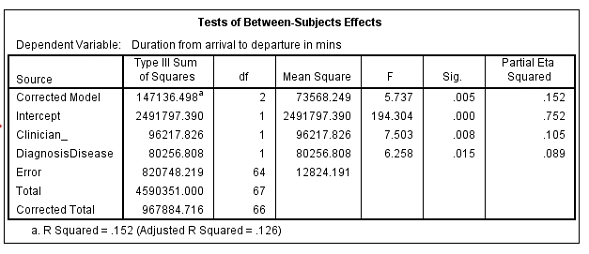
The Univariate test accepts the alternate hypothesis of duration from arrival to departure time for clinicians and diagnosis of disease. Thus, the length of stay in the hospital is dependent upon the clinicians and the disease. Below graph table clearly illustrates the significant difference in length of stay in hospital for disease and clinicians.
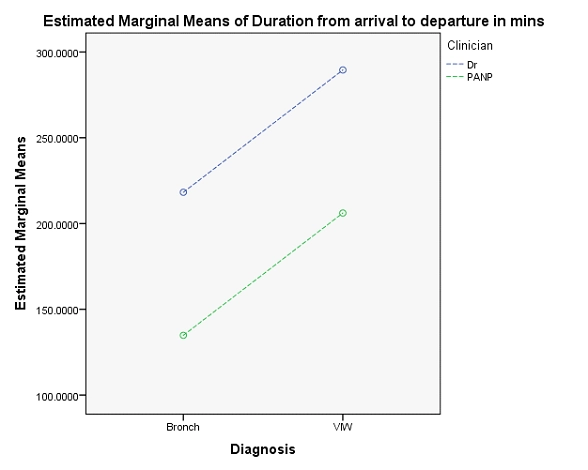
Figure 11 Duration from arrival to departure
Table 11 Association between arrivals to departure for clinicians
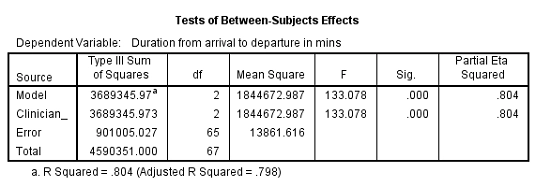
The Univariate test accepts the alternate hypothesis of duration from arrival to departure time for clinicians. Thus, there is a significant relationship between clinicians and the time of stay in hospital for patients. The graph below clearly depicts the difference between ANPs and clinicians.
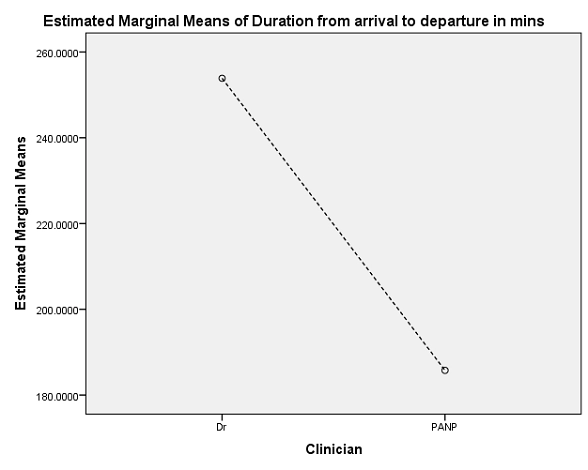
Figure 12 Duration from arrival to departure for clinicians
The research aims to find the impact of the practice of advanced nurse practitioner (ANP) care on the children of age three to five months associated with viral-induced wheeze and bronchiolitis disease. This associative study is conducted to compare the impact of doctors and ANPs in an emergency setting. The study has used frequency analysis, descriptive statistics, Pearson Chi-Square test and Univariate analysis for analysing the results. A significant association was found between integrated clinical pathways and clinicians. While the readmission in the next 7 days after initial treatment has no association with clinicians. A strong association was found between the integrated care pathway and clinicians. Furthermore, no relationship was found between clinicians’ reviews and diagnosis. Therefore, it can be inferred that ANPs do not have a significant impact on the acute management of children aged 3 months to 5 years as compared to doctors in an emergency setting.
To perform a Master’s dissertation in Nursing statistical analysis:
1. Define research questions.
2. Collect relevant data.
3. Choose appropriate statistical tests.
4. Analyze data using software (e.g., SPSS).
5. Interpret findings.
6. Discuss implications and present results clearly.
You May Also Like
All work is written by human writers. 100% AI free, guaranteed.
100% money back guarantee if you find plagiarism in our work.
COMPANY DETAILS


