Here is a sample that showcases why we are one of the world’s leading academic writing firms. This assignment was created by one of our UK assignment writers and demonstrated the highest academic quality. Place your order today to achieve academic greatness.
Table of Contents
This report aims to analyze the health status of respondents by calculating their BMI and hip to waist ration. To achieve the report aims, the respondents were asked to give information regarding their age, height, weight, and other. The data was gathered from thirteen respondents out of which 3 were male whereas 10 were female.
For each variable, the average value and standard deviation was calculated using the Microsoft Excel. The results obtained were further calculated for both male and female separately. Moreover, the standard deviation of data was also calculated. To calculate these, the formulas were used from Excel formula bar.
The results depicted that on average, respondents were 23 years old. The average age of make respondents was 24.66 whereas that of female was 22.4. The average age of respondents was 64.68kg with male having high weight (77kg) compared to female (60.85kg). As long as the information about the body fat was concerned, two of the respondents did not know their body fat percentage, fat mass, and fat free mass thus the value is not true representative of sample. Table 1 showed the average and standard deviation of body fat percentage, fat mass, and fat free mass of sample.
| Participant No | Body fat percentage (%) | Fat mass (kg) | Fat free mass (kg) |
| P1 | 20.7 | 12.4 | 47.2 |
| P2 | 24.2 | 16.8 | 52.8 |
| P3 | 7 | 4.4 | 57 |
| P4 | 19.2 | 8.8 | 37.2 |
| P5 | 41.9 | 35.4 | 49 |
| P6 | 28.5 | 17.2 | 43.4 |
| P7 | 29 | 17.8 | 42 |
| P8 | 4.6 | 2.8 | 60 |
| P9 | 25.4 | 13.4 | 39.2 |
| P10 | – | – | – |
| P11 | – | – | – |
| P12 | 13.4 | 6.8 | 44.2 |
| P13 | 23.7 | 25.6 | 82.6 |
| SD | 10.56427944 | 9.58885717 | 12.83821001 |
| Avg | 21.6 | 14.67272727 | 50.41818182 |
| Avg (M) | 11.76666667 | 10.93333333 | 66.53333333 |
| Avg (F) | 25.2875 | 16.075 | 44.375 |
| SD (M) | 10.40400564 | 12.72687445 | 13.99476092 |
| SD (F) | 8.457361544 | 8.76547611 | 5.144136746 |
Table 1
The health status was also calculated by asking the blood pressure level and heart rate. Moreover, the oxygen level of respondents were also asked. The average systolic blood pressure of respondents was 103.69 mm/Hg. Female has high average systolic blood pressure (105 mm/Hg) compared to male (97.33 mm/Hg). On the other hand, the average diastolic blood pressure was 73.66 mm/Hg (male = 78.43, female = 72.23). Figure 1 showed the heart rate of respondents measured in BPM:
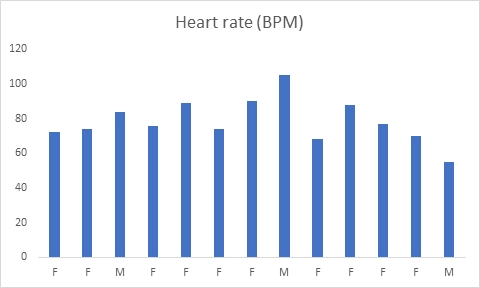
Figure 1
As indicated in figure, male has high average heart rate (81.33) compared to female having the heart rate 77.8 (SD = ±8.17).
Following is the oxygen level of respondents and it is compared with their age and sex.
| Sex | Age | Oxygen saturation (SpO2) |
| F | 20 | 98 |
| F | 19 | 98 |
| M | 20 | 97 |
| F | 19 | 98 |
| F | 33 | 99 |
| F | 25 | 98 |
| F | 20 | 95 |
| M | 19 | 95 |
| F | 20 | 70 |
| F | 20 | 99 |
| F | 19 | 99 |
| F | 29 | 98 |
| M | 35 | 93 |
The results showed that average oxygen saturation level of respondents was 95.15 where female has high oxygen saturation level compared to male (Male = 95, Female = 95.2) (see figure 2)
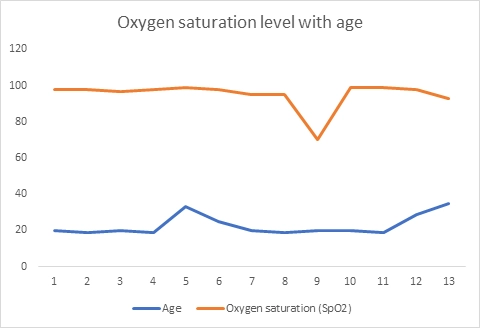
Figure 2
Waist to hip ratio
To calculate the waist to hip ratio of respondents, they were asked for their hip circumference (cm) and waist circumference (cm).
The formula applied to calculate the waist to hip ration is as following:
w/h = Waist circumference (cm)/ Hip circumference (cm)
The results obtained are as following:
| Participant No | Sex | Waist circumference (cm) | Hip circumference (cm) | (w/h) |
| P1 | F | 76 | 100 | 0.76 |
| P2 | F | 77 | 101 | 0.76 |
| P3 | M | 71 | 91 | 0.78 |
| P4 | F | 67 | 93 | 0.72 |
| P5 | F | 84 | 116 | 0.72 |
| P6 | F | 73 | 110 | 0.66 |
| P7 | F | 71 | 94 | 0.76 |
| P8 | M | 73 | 94 | 0.78 |
| P9 | F | 69 | 95 | 0.73 |
| P10 | F | 77 | 95 | 0.81 |
| P11 | F | 70 | 97 | 0.72 |
| P12 | F | 61 | 92 | 0.66 |
| P13 | M | 103 | 115 | 0.9 |
| SD | 10.14194135 | 8.675784159 | 0.062231353 | |
| Avg | 74.76923077 | 99.46153846 | 0.750679282 | |
| Avg (M) | 82.33333333 | 100 | 0.82 | |
| Avg (F) | 76.7 | 99.3 | 0.73 | |
| Std (M) | 17.92577288 | 13.07669683 | 0.070224693 | |
| std (F) | 6.398784607 | 7.888810641 | 0.045262842 |
Table 3
Since female having the waist to hip ration below 0.80 are considered healthy, all of the female respondents were health except one having the ration 0.81. On the other hand, all the male were healthy since all of them have ration below 0.95.
Body mass Index (BMI)
The report aims to analyze the body mass index of respondents that require the body weight in kg and height in meters. The height was gathered in centimeters therefore it was first converted into meters by diving the values with 100.
The formula to calculate BMI is as following:
BMI = weight/h*2
Following is the BMI of respondents who took part in this study:
| Sex | Height (cm) | Height (m) | Weight (kg) | BMI |
| F | 165 | 1.65 | 59.6 | 21.9 |
| F | 178 | 1.78 | 69.6 | 22 |
| M | 176 | 1.76 | 61.4 | 19.8 |
| F | 157 | 1.57 | 46 | 18.7 |
| F | 165 | 1.65 | 84.4 | 31 |
| F | 166 | 1.66 | 60.6 | 22 |
| F | 159 | 1.59 | 59.8 | 23.7 |
| M | 180 | 1.8 | 62.8 | 19.4 |
| F | 155 | 1.55 | 52.6 | 21.9 |
| F | 159 | 1.59 | 67.2 | 26.6 |
| F | 156 | 1.56 | 57.7 | 23.7 |
| F | 165 | 1.65 | 51 | 18.7 |
| M | 175 | 1.75 | 108.2 | 35.3 |
The results showed that majority of respondents have a normal BMI (ranges 18.5-24.9). However, two of them were obese and one of the was overweight. This shows that sample population was healthy and by following the same lifestyle they can achieve that sustainable body index.
This report aims to analyze the health status of a group of people. To assess the health status of participants, the body mass index (BMI) and waist to hip ratio was calculated. The input required were asked from respondents and data was entered into the Microsoft Excel. The average of each variable such as age, weight, height, body fat, blood pressure, and heart rate were calculated. Moreover, the standard deviation was calculated as well. For further investigation, the average of each variable was calculated for male and female separately. The results showed that majority of respondents were female and average age was 22.92. The average BMI of respondents was 23.43 which was normal showing that sample population was healthy.
To calculate Standard Deviation as a nutritionist:
1. Determine the mean of a data set (e.g., calorie intake).
2. Calculate the difference between each data point and the mean.
3. Square each difference.
4. Find the average of the squared differences.
5. Take the square root of the average.
You May Also Like
All work is written by human writers. 100% AI free, guaranteed.
100% money back guarantee if you find plagiarism in our work.
COMPANY DETAILS


