Here is a sample that showcases why we are one of the world’s leading academic writing firms. This assignment was created by one of our expert academic writers and demonstrated the highest academic quality. Place your order today to achieve academic greatness.
Table of Contents
Emotional expressions are the involuntary manifestation and inherited which highlights one’s inner state. Over the years, many psychologists have pursued the understanding of the facial expression of individuals which is now expressed as the ‘facial feedback hypothesis’ which indicates that emotional expressions are the centre of the brain and facial muscles are bidirectional. On the other hand, the replication crisis which originated in the early 2010s highlights that scientists are questioning the credibility and accuracy of psychological science. The main aim of the study is to evaluate the facial expressions of the individuals based on perceiving cartoons while experimenting on a different group. The experimental group consisted of a smile, pout or control condition where the participants were told to hold pencils with their mouth forcing a smile, forcing a pout or holding the pencil in hand. The research design for the study is quantitative research design and the research experimental design is based on between subjects based on the participant’s responses. The first technique that was incorporated into the results was the normality testing where the Shapiro Wilk test revealed that the data is normally distributed. Hence, the one-way Anova with Tukey post hoc test is applied. The results revealed that there was no significant difference between the groups (smile, pout and control condition) regarding the rating of pictures based on their funniness.
As per the study of Brinke, Porter and Baker (2012), the emotional expressions are the involuntary manifestation and inherited which highlights one’s inner state. Charles Darwin considered the facial expression to be the ‘chief’ emotional signal of an individual. In addition, Darwin 1872 highlighted a theory in which the free expression of an individual is commonly influenced by the external emotional factors which either intensify the expressions or result in softer expression (Colzato, Sellaro and Beste, 2017). Moreover, the study conducted by Anderson and Adolphs (2014) has highlighted that the emotions consist of certain expressive behaviour which is reflected in the internal brain and are expressed as “feelings”.
The interest in emotions and regulations has been significantly increasing over the year mainly in neuroscience and psychiatry. Wolf (2015) has highlighted that investigation of emotional expressions has led to several questions as to whether emotions are shared across cultures and why is it important for examining the feeling which is considered as ‘basic feeling’. In Darwin’s book “The Expression of Emotions in Man and Animals”; it has been studied that the body serves as an adaptive function that deals with the events that foster the organism’s well-being, reproductive value and survival (Dael, Mortillaro and Scherer, 2012).
Over the years, many psychologists have pursued an understanding of the facial expression of individuals which is now expressed as the ‘facial feedback hypothesis’ which indicates that emotional expressions are the centre of the brain and facial muscles are bidirectional. Research has revealed that the individuals rated the cartoons as funnier when smiling than when frowning (Finzi and Rosenthal, 2016). On the other hand, Hodson et al. (n.d.) indicate the replication crises which originated in the early 2010s and highlight that scientists are questioning the credibility and accuracy of psychological science. Hence, the following research is emphasized understanding the facial expression of the individuals based on perceiving cartoons. The study adopts the quantitative methods for evaluating the difference in perceiving cartoons as funnier or not based on the facial expression which is smile, pout or control condition.
The main aim of the study is to evaluate the facial expressions of the individuals based on perceiving cartoons while experimenting on a different group.
H1: Smile conditions result in a higher rating than the control and pout condition
H0: Smile condition does not result in a higher rating than the control and out condition
H2: Pout conditions result in a lower rating than the control and smile condition
H0: Pout condition does not result in a lower rating than the control and smile condition
The research design for the study is a quantitative research design in which the data is given in the form of numbers and thus the statistical techniques are applied to the dataset for determining the findings of the study. As per the study of Goertz and Mahoney (2012), quantitative research ignores the subjective view where only the numbers are interpreted for revealing the results. In addition, the research experimental design is based on subjects based on the participant’s responses. The independent variable of the study is the rating provided on an image of a cartoon. The dependent variables are divided into three categories which consist of smile, pout and control.
The total number of participants that contributed to the small experiment for analysing the facial expression based on cartoon images is around 251 participants. On the other hand, only 214 of the participants have finished the experiment whereas 37 did not complete the test. The average age group of the participants whose data is utilized was 39 the minimum age of the participant was 17 and the maximum age was 77. Concerning the gender of the participant, 59.2% were female, 25.2% were male, 0.8% were under others and 0.4% did not prefer to state their gender.
The materials that were required for conducting the experimental project were access to the internet, a pen, information about the experience and links for other information such as data protection and 3 sets of instruction. The first instruction was related to the sampling of the group which were 3 groups which consist of pouting, smiling and control. The second condition was that the participant was required to hold the pen in their hand. Lastly, the oxford happiness questionnaire was required for measuring the happiness of the participants which consisted of 9 questions. In addition, the Likert scale is used for measuring happiness which consists of a seven-point scale and a rating of the image which was a five-point scale for enabling the individuals to express their liking of the statement.
The instruction was properly explained before the experiment in which the minimum age of the participant must be 16 and required consent. The participants were randomly assigned to the three groups in which the 1 group was required to hold a pencil with their mouth and force a smile (smile condition). The second group were forced to pout while holding a pencil with their mouth and the third group was required to hold it in their hand. Once this was completed, they were required to complete the Oxford happiness questionnaire which was a filler task. At the end of the questionnaire, the participants were required to rate four cartoons on a scale of 1 to 5 with which 1 is not funny and 5 are very funny.
The statistical technique that is incorporated in the study is the normality testing of the data for determining whether the data is normally distributed and parametric. The purpose of the technique was to identify a suitable statistical technique that can support generating the proper results. Lastly, the One-way ANOVA testing is conducted as the experimental design is identified as between-subjects where 3 subjects are drawn which consist of smile, pout and control.
Professional editors proofread and edit your paper by focusing on:

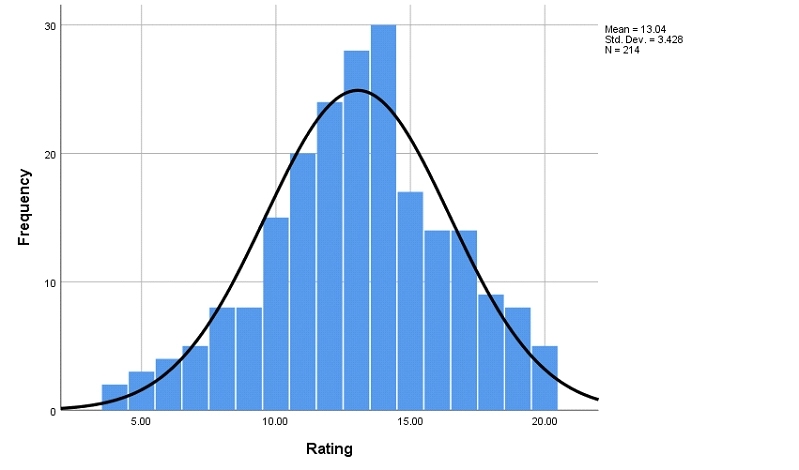
The above graph represents the part of normality testing in which the histogram of the variable rating is provided to determine whether it has a bell-shaped curve. Concerning the above graph, it is indicated that the ratings provided on the image of the 4 cartoons by 214 participants are bell-shaped indicating that the rating is normally distributed
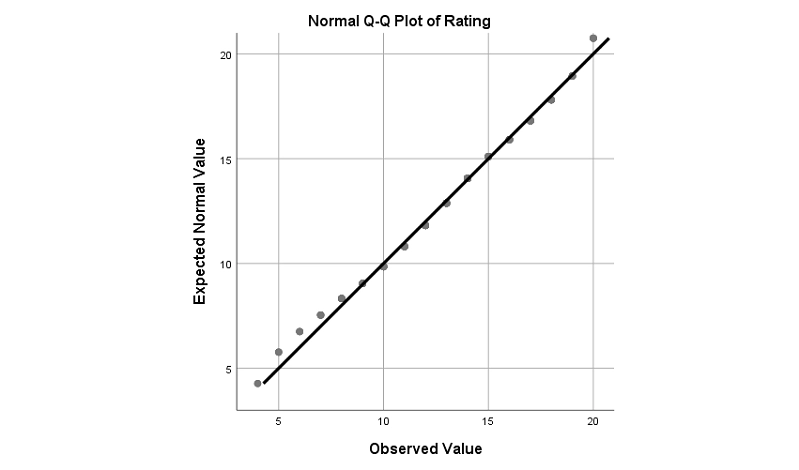
Furthermore, the Q-Q plotting of the rating of the carton is also provided above in which it is clear that observed values are closer to the linear line which indicates that the data is normally distributed.
| Tests of Normality | |||||||
| Condition | Kolmogorov-Smirnova | Shapiro-Wilk | |||||
| Statistic | df | Sig. | Statistic | df | Sig. | ||
| Rating | smiles | .119 | 72 | .013 | .962 | 72 | .027 |
| PoutC | .082 | 66 | .200* | .977 | 66 | .259 | |
| control | .084 | 76 | .200* | .985 | 76 | .522 | |
| *. This is a lower bound of the true significance. | |||||||
| a. Lilliefors Significance Correction | |||||||
The last test that is applied for measuring the normality of the data set is through Shapiro-Wilk. The normality testing is applied on rating along with the 3 groups which consist of smile, pout and control. Concerning the results, the significance value of the smile condition is found to be 0.027 which is lower than 0.05; hence, this indicates that the rating on the smile condition is not normally distributed. On the other hand, the pout and control condition’s significance value is found to be greater than 0.05 on Shaprio-Wilk test.
As per the results of normality testing, the dataset is normally distributed; hence, the one-way ANOVA is applied for determining the significant differences between the mean of the three groups which are identified as smile, pout and control. The Tukey HSD post hoc test is applied to the dataset as the data falls under the parametric data which has supported making comparisons and differences between the groups.
| Descriptive | ||||||||||
| Rating | ||||||||||
| N | Mean | Std. Deviation | Std. Error | 95% Confidence Interval for Mean | Minimum | Maximum | Between-Component Variance | |||
| Lower Bound | Upper Bound | |||||||||
| SmileC | 72 | 12.6250 | 3.37112 | .39729 | 11.8328 | 13.4172 | 5.00 | 19.00 | ||
| PoutC | 66 | 13.6818 | 3.29176 | .40519 | 12.8726 | 14.4910 | 4.00 | 20.00 | ||
| ControlC | 76 | 12.8816 | 3.55890 | .40823 | 12.0683 | 13.6948 | 4.00 | 20.00 | ||
| Total | 214 | 13.0421 | 3.42774 | .23432 | 12.5802 | 13.5039 | 4.00 | 20.00 | ||
| Model | Fixed Effects | 3.41528 | .23346 | 12.5818 | 13.5023 | |||||
| Random Effects | .31171 | 11.7009 | 14.3832 | .12754 | ||||||
The above table represents the descriptive statistics of the rating and conditions in which the total number of participants that have been given the experiment smile condition were 73. The mean value of the smile condition is computed as 12.62 whereas the standard deviation is computed as 3.37 which highlights the dispersion of the rating. The minimum value is 5 whereas the maximum value is 19. While referring to the pout condition, the mean value was 13.68 which is higher than the smile condition. This indicates that the individuals that were experimented with in the pout condition found the cartoon image funny compared to the smile condition. Lastly, the total number of participants who contributed to the control condition was 75 with which the mean value was 12.88 which was comparatively higher than the smile condition but lower than the pout condition.
| Multiple Comparisons | ||||||
| Dependent Variable: Rating | ||||||
| Tukey HSD | ||||||
| (I) Condition | (J) Condition | Mean Difference (I-J) | Std. Error | Sig. | 95% Confidence Interval | |
| Lower Bound | Upper Bound | |||||
| SmileC | PoutC | -1.05682 | .58201 | .167 | -2.4306 | .3169 |
| ControlC | -.25658 | .56167 | .891 | -1.5823 | 1.0692 | |
| PoutC | SmileC | 1.05682 | .58201 | .167 | -.3169 | 2.4306 |
| ControlC | .80024 | .57463 | .347 | -.5561 | 2.1566 | |
| ControlC | SmileC | .25658 | .56167 | .891 | -1.0692 | 1.5823 |
| PoutC | -.80024 | .57463 | .347 | -2.1566 | .5561 | |
The above table reflects on the Tukey post hoc results in which the comparison has been made between the three conditions among each other based on the rating of images. While referring to the smile condition, it is found to have no difference with the pout condition and control condition due to the significant value being higher than 0.05 which was 0.167 and 0.891, respectively. While referring to the pout condition, it is found to have no significant difference between the smile and control condition due to the significant value being 0.167 and 0.347.
The following study seeks to analyse the facial expression of the individuals in which the participants are involved in an experiment where they would be in a smile, pout or control condition. The purpose of the task was to determine the difference in facial expression between the three groups. The first technique that was incorporated into the results was the normality testing where the Shapiro Wilk test is applied for determining the normality of the data. Based on the results, it was found that the data is normally distributed and thus the one-way ANOVA is incorporated with the Tukey post hoc test. The results revealed that there was no significant difference between the groups (smile, pout and control condition) regarding the rating of the picture based on its fun element. Therefore, both the hypotheses H1 and H2 were rejected as the first hypothesis was related to the smiling group having a higher rating than the pout and control group and the second hypothesis was related to the pout group having a lower rating and the null hypothesis is selected. Similarly, the findings of Strack, Stepper and Martin (1988) have revealed that facial expressions operate on affective rather than the cognitive component such as humour response.
While referring to the limitations, the total number of participants in the smile, pout and control conditions were different. Hence, it is recommended for keeping the number of participants the same in the smile, pout and control conditions for improving the robustness of the results. Concerning the results, it is clear that the experimental groups such as smile; control and pout conditions do not have a significant effect on the humour response of the participant. Future studies can be conducted by incorporating interviews or qualitative methods for understanding the facial expression of the individual.
Anderson, D.J. and Adolphs, R., (2014). A framework for studying emotions across species. Cell, 157(1), pp.187-200.
Colzato, L.S., Sellaro, R. and Beste, C., (2017). Darwin revisited: The vagus nerve is a causal element in controlling the recognition of other’s emotions. Cortex, 92, pp.95-102.
Dael, N., Mortillaro, M. and Scherer, K.R., (2012). Emotion expression in body action and posture. Emotion, 12(5), p.1085.
Finzi, E. and Rosenthal, N.E., (2016). Emotional proprioception: treatment of depression with afferent facial feedback. Journal of psychiatric research, 80, pp.93-96.
Goertz, G. and Mahoney, J., (2012). A tale of two cultures: Qualitative and quantitative research in the social sciences. Princeton University Press
Hodson, G., Ebersole, C., Danvers, C. & Chaterjee, A. (n.d.) Replication Crisis Reproducibility Crisis Online accessed 11/01/2020 Psychology Today https://www.psychologytoday.com/us/basics/replication-crisis
Strack, F., Martin, L.L. and Stepper, S., (1988). Inhibiting and facilitating conditions of the human smile: a nonobtrusive test of the facial feedback hypothesis. Journal of personality and social psychology, 54(5), p.768.
Ten Brinke, L., Porter, S. and Baker, A., (2012). Darwin the detective: Observable facial muscle contractions reveal emotional high-stakes lies. Evolution and Human Behavior, 33(4), pp.411-416.
Wolf, K., (2015). Measuring facial expression of emotion. Dialogues in clinical neuroscience, 17(4), p.457.
You May Also Like
All work is written by human writers. 100% AI free, guaranteed.
100% money back guarantee if you find plagiarism in our work.
COMPANY DETAILS


