Here is a sample that showcases why we are one of the world’s leading academic writing firms. This assignment was created by one of our expert academic writers and demonstrated the highest academic quality. Place your order today to achieve academic greatness.
Table of Contents
The collected data was inputted into SPSS software to analyze it statistically. To check the reliability of the data, Cronbach’s alpha test has been applied. By measuring internal consistency, it assures reliability. Cronbach’s alpha greater value than 0.5 indicates the strength of the data. Overall collected data has been segregated into three categories as physical activity, child-eating behavior before the pandemic, and child’s eating behavior during the pandemic. The alpha values are 0.9 which shows excellent data reliability.
| Reliability Statistics | ||
| Cronbach’s Alpha | Cronbach’s Alpha Based on Standardized Items | N of Items |
| .957 | .868 | 14 |
| Reliability Statistics | ||
| Cronbach’s Alpha | Cronbach’s Alpha Based on Standardized Items | N of Items |
| .956 | .955 | 35 |
| Reliability Statistics | ||
| Cronbach’s Alpha | Cronbach’s Alpha Based on Standardized Items | N of Items |
| .909 | .920 | 36 |
A t-test for paired samples was applied to the data to test the stated hypothesis. Though the nature of the study is comparative, and data needed to be analyzed by comparing two groups. Therefore, the t-test is the most recommended inferential analysis approach. There are three types of t-tests. One-sample t-test that includes one variable only, verifies the mean for the total population considered for the study.
The second type is a two-sample test that includes two variables, used for nominal or ordinal data in nature, it compares two groups by keeping other factors constant. The third is paired t-test, which is used to compare two groups by relating before and after situations. It includes two variables, computes the mean comparisons, and applies to nominal or ordinal data.
The mean represents the mean of the sample, its value indicates equality/inequality among population means. The table presents a mean value greater than 0 which indicates the mean is not equal among the respondents of the study.
Standard deviation represents the scatteredness of data with respect to the mean. A low value for standard deviation indicated data clustering around its mean whereas, a greater value represents data scatteredness. The below table is showing a standard deviation value in the range of 0-1.9 that compliments the mean of the collected data and assures data reliability as well.
95% confidence level explains the acceptance of the hypothesis among the sample size. it encounters for 95% of the population. Its value is dependent on sample size. The larger the sample size more conservative the value will come out. In the table, its value is ranging in between 1 – and 2 showing every 1, or 2 respondents in the sample have responded to the positive hypothesis.
The t- value reflects the difference between the results of a pair. The greater the value, the more the difference exists. The significance value denoted as the p-value accepts or rejects the null hypothesis. It requires at least 0.5 or 50% to reject the null hypothesis. In the table below, 8 pairs are showing a p-value lesser than 0.5 out of 35 pairs, concluding 22.8% had accepted the null hypothesis whereas, 77.14% of the results have rejected the null hypothesis that asserts, there is a significant difference in child eating behavior in comparison to before and during the pandemic; covid-19
| Paired Samples Test | |||||||||
| Paired Differences | t | df | Sig. (2-tailed) | ||||||
| Mean | Std. Deviation | Std. Error Mean | 95% Confidence Interval of the Difference | ||||||
| Lower | Upper | ||||||||
| Pair 1 | MY CHILD LOVES FOOD – MY CHILD LOVES FOOD | 1.68367 | .99856 | .02201 | 1.64051 | 1.72684 | 76.490 | 2057 | 0.8482 |
| Pair 2 | MY CHILD EATS MORE WHEN WORRIED – MY CHILD EATS MORE WHEN WORRIED | 1.65251 | 1.04165 | .02547 | 1.60255 | 1.70248 | 64.869 | 1671 | 0.9348 |
| Pair 3 | MY CHILD HAS A BIG APETITE – MY CHILD HAS A BIG APETITE | 1.67250 | 1.01646 | .02241 | 1.62856 | 1.71644 | 74.645 | 2057 | 0.6254 |
| Pair 4 | MY CHILD FINISH MEALS QUICKLY – MY CHILD FINISH MEALS QUICKLY | 1.67541 | 1.00972 | .02226 | 1.63176 | 1.71906 | 75.274 | 2057 | 0.7296 |
| Pair 5 | MY CHILD IS INTERESTED IN FOOD – MY CHILD IS INTERESTED IN FOOD | 1.67833 | 1.00873 | .02224 | 1.63472 | 1.72194 | 75.479 | 2057 | 0.5891 |
| Pair 6 | MY CHILD IS ALWAYS ASKING FOR DRINK – MY CHILD IS ALWAYS ASKING FOR DRINK | 1.83382 | .89972 | .01980 | 1.79498 | 1.87266 | 92.598 | 2063 | 0.3258 |
| Pair 7 | MY CHILD REFUSES FOOD AT FIRST – MY CHILD REFUSES FOOD AT FIRST | 1.67541 | 1.01212 | .02231 | 1.63166 | 1.71917 | 75.095 | 2057 | .5410 |
| Pair 8 | MY CHILD EATS SLOWLY – MY CHILD EATS SLOWLY | 1.67250 | 1.02123 | .02251 | 1.62835 | 1.71664 | 74.296 | 2057 | .8247 |
| Pair 9 | MY CHILD EATS LESS WHEN ANGRY – MY CHILD EATS LESS WHEN ANGRY | 1.68076 | 1.00685 | .02219 | 1.63723 | 1.72428 | 75.730 | 2057 | .7471 |
| Pair 10 | MY CHILD ENJOY TASKING NEW FOOD – MY CHILD ENJOY TASKING NEW FOOD | 1.71777 | .95754 | .02116 | 1.67628 | 1.75927 | 81.184 | 2047 | .6480 |
| Pair 11 | MY CHILD EATS MORE WHEN HE/SHE TIRED – MY CHILD EATS MORE WHEN HE/SHE TIRED | 1.67833 | 1.00969 | .02226 | 1.63468 | 1.72198 | 75.407 | 2057 | .5586 |
| Pair 12 | MY CHILD IS ALWAYS ASKING FOR FOOD – MY CHILD IS ALWAYS ASKING FOR FOOD | 1.67541 | 1.00924 | .02225 | 1.63178 | 1.71904 | 75.310 | 2057 | .8451 |
| Pair 13 | MY CHILD EATS MORE WHEN ANNOYED – MY CHILD EATS MORE WHEN ANNOYED | 1.67250 | 1.02075 | .02250 | 1.62837 | 1.71662 | 74.331 | 2057 | .3218 |
| Pair 14 | IF ALLOWED TOO, MY CHILD EATS TOO MUCH – IF ALLOWED TOO, MY CHILD EATS TOO MUCH | 1.67930 | 1.00711 | .02220 | 1.63576 | 1.72284 | 75.644 | 2057 | .2304 |
| Pair 15 | MY CHILD EATS MORE WHEN ANXIOUS – MY CHILD EATS MORE WHEN ANXIOUS | 1.73379 | .90668 | .01995 | 1.69467 | 1.77290 | 86.917 | 2065 | .7825 |
| Pair 16 | MY CHILD ENJOYS A WILD VARIETY OF FOOD – MY CHILD ENJOYS A WILD VARIETY OF FOOD | 1.67833 | 1.01065 | .02228 | 1.63464 | 1.72202 | 75.335 | 2057 | .6129 |
| Pair 17 | MY CHILD LEAVES FOOD AT HIS/HER PLATE AT THE END OF MEAL – MY CHILD LEAVES FOOD AT HIS/HER PLATE AT THE END OF MEAL | 1.67250 | 1.01741 | .02243 | 1.62852 | 1.71648 | 74.575 | 2057 | .4794 |
| Pair 18 | MY CHILD TAKES MORE THAN 30 MINUTES TO FINISH A MEAL – MY CHILD TAKES MORE THAN 30 MINUTES TO FINISH A MEAL | 1.67541 | 1.01500 | .02237 | 1.63153 | 1.71929 | 74.882 | 2057 | .7812 |
| Pair 19 | GIVEN THE CHOICE, MY CHILD WILL EAT MOST OF THE TIME – GIVEN THE CHOICE, MY CHILD WWILLEAT MOST OF THE TIME | 1.67930 | 1.01048 | .02227 | 1.63562 | 1.72298 | 75.392 | 2057 | .1847 |
| Pair 20 | MY CHILD LOOKS FORWARDS TO MEAL TIME – MY CHILD LOOKS FORWARDS TO MEAL TIME | 1.68076 | 1.00540 | .02216 | 1.63730 | 1.72422 | 75.839 | 2057 | .6480 |
| Pair 21 | MY CHILD GETS FULL BEFORE HIS MEALS GET FINISHED – MY CHILD GETS FULL BEFORE HIS MEALS GET FINISHED | 1.67541 | 1.00972 | .02226 | 1.63176 | 1.71906 | 75.274 | 2057 | .1687 |
| Pair 22 | MY CHILD ENJOYS EATING – MY CHILD ENJOYS EATING | 1.67833 | 1.00921 | .02225 | 1.63470 | 1.72196 | 75.443 | 2057 | .5104 |
| Pair 23 | MY CHILD EATS LESS WHEN UPSET – MY CHILD EATS MORE WHEN HE/SHE IS HAPPY | 1.67833 | 1.01065 | .02228 | 1.63464 | 1.72202 | 75.335 | 2057 | .6214 |
| Pair 24 | MY CHILD IS DIFFICULT TO PLEASE WITH MEAL – MY CHILD IS DIFFICULT TO PLEASE WITH MEAL | 1.67541 | 1.01835 | .02245 | 1.63139 | 1.71944 | 74.636 | 2057 | .2493 |
| Pair 25 | MY CHILD EATS LESS WHEN UPSET – MY CHILD EATS LESS WHEN UPSET | 1.67833 | 1.00728 | .02220 | 1.63478 | 1.72187 | 75.588 | 2057 | .6214 |
| Pair 26 | MY CHILD GETS FULL EASILY – MY CHILD GETS FULL EASILY | 1.67930 | 1.00807 | .02222 | 1.63572 | 1.72288 | 75.572 | 2057 | .4158 |
| Pair 27 | MY CHILD EATS MORE WHEN HE/SHE HAS NOTHING ELSE TO DO – MY CHILD EATS MORE WHEN HE/SHE HAS NOTHING ELSE TO DO | 1.64494 | 1.04702 | .02309 | 1.59966 | 1.69023 | 71.237 | 2055 | .7401 |
| Pair 28 | EVEN IF MY CHILD HAS FULL UP HE/SHE FINDS ROOM TO EAT HIS/HER FAVORITE FOOD – EVEN IF MY CHILD HAS FULL UP HE/SHE FINDS ROOM TO EAT HIS/HER FAVORITE FOOD | 1.67541 | 1.01883 | .02246 | 1.63137 | 1.71946 | 74.601 | 2057 | .6412 |
| Pair 29 | IF GIVEN THE CHANCE, MY CHWOULDWOLD ALWAYS HAVE FOOD IN HIS/HER MOUTH – IF GIVEN THE CHANCE, MY CHILD WOULD DRINK CONTINUOUSLY THROUGHOUT THE DAY | 1.67541 | .95325 | .02101 | 1.63420 | 1.71662 | 79.733 | 2057 | .5304 |
| Pair 30 | MY CHILD CANNOT EAT A MEAL IF S/HE HAD A SNACK JUST BEFORE MEAL – MY CHILD CANNOT EAT A MEAL IF S/HE HAD A SNACK JUST BEFORE MEAL | 1.68076 | 1.00733 | .02220 | 1.63721 | 1.72430 | 75.693 | 2057 | .8461 |
| Pair 31 | IF GIVEN A CHANCE, MY CHILD WOULD ALWAYS BE DRINKING – IF GIVEN A CHANCE, MY CHILD WOULD ALWAYS BE DRINKING | 1.67541 | 1.01883 | .02246 | 1.63137 | 1.71946 | 74.601 | 2057 | .3128 |
| Pair 32 | MY CHILD IS INTERESTED IN TASTING FOOD S/HE NEVER TASTED BEFORE – MY CHILD IS INTERESTED IN TASTING FOOD S/HE NEVER TASTED BEFORE | 1.67833 | 1.01257 | .02232 | 1.63456 | 1.72210 | 75.192 | 2057 | .6198 |
| Pair 33 | MY CHILD DECIDES THAT S/HE DOESNT LIKE THE FOOD, EVEN WITHOUT TASTING IT – MY CHILD DECIDES THAT S/HE DOESNT LIKE THE FOOD, EVEN WITHOUT TASTING IT | 1.67833 | 1.01113 | .02229 | 1.63462 | 1.72204 | 75.299 | 2057 | .8124 |
| Pair 34 | IF GIVEN A CHANCE, MY CHILD WOULD ALWAYS HAVE FOOD IN HIS/HER MOUTH – IF GIVEN CHANCE, MY CHILD WOULD ALWAYS HAVE FOOD IN HIS/HER MOUTH | 1.67930 | 1.00904 | .02224 | 1.63568 | 1.72292 | 75.500 | 2057 | .7348 |
| Pair 35 | MY CHILD EATS MORE AND MORE SLOWLY DURING A MEAL – MY CHILD EATS MORE AND MORE SLOWLY DURING A MEAL | 1.68076 | 1.00636 | .02218 | 1.63725 | 1.72426 | 75.766 | 2057 | .7425 |
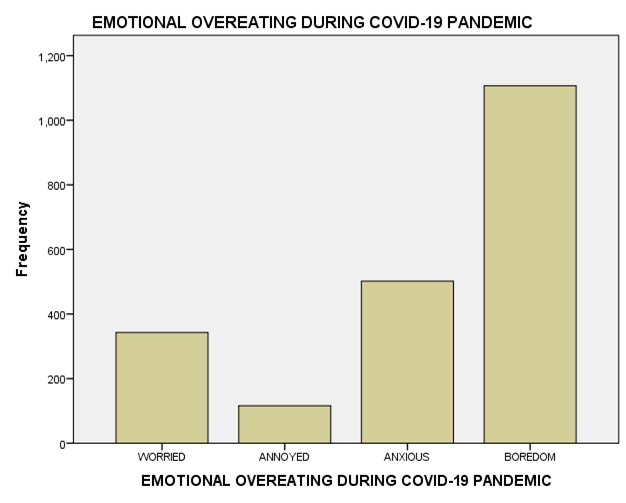
Below 5 – a figure summary table is depicting the proportion of kid’s overeating habits caused by emotions; worried, annoyed, anxiety, and boredom during covid-19. Many guardians highlighted boredom and anxiety are the main reasons.
| EMOTIONAL OVEREATING DURING COVID-19 PANDEMIC | |||||
| Frequency | Percent | Valid Percent | Cumulative Percent | ||
| Valid | WORRIED | 343 | 16.5 | 16.6 | 16.6 |
| ANNOYED | 116 | 5.6 | 5.6 | 22.2 | |
| ANXIOUS | 502 | 24.1 | 24.3 | 46.5 | |
| BOREDOM | 1107 | 53.2 | 53.5 | 100.0 | |
| Total | 2068 | 99.3 | 100.0 | ||
| Missing | System | 14 | .7 | ||
| Total | 2082 | 100.0 | |||
The mean value in the below table is in a range lesser than 2 whereas the standard deviation value is in the range from 0 – 1 indicating the data is clustered to the mean point. 95% confidence level is highlighting every 1 or 2 guardians among respondents are accepting the hypothesis. Where magnitude for t-value is not greater as it was for eating habits for kids, showing a lesser difference happened noticed in between two periods. Out of 7 queries, 2 statements had accepted the null hypothesis with the values: 0.3 and 0.2. whereas 71.4% of respondents have accepted the hypothesis that reflects, that there is a significant association between children’s physical activity with the pandemic.
| Paired Samples Test | |||||||||
| Paired Differences | t | df | Sig. (2-tailed) | ||||||
| Mean | Std. Deviation | Std. Error Mean | 95% Confidence Interval of the Difference | ||||||
| Lower | Upper | ||||||||
| Pair 1 | 4-6 TIMES A WEEK – 4-6 TIMES A WEEK | 1.46989 | .66141 | .01476 | 1.44095 | 1.49883 | 99.610 | 2008 | .374 |
| Pair 2 | 2-3 TIMES A WEEK – 2-3 TIMES A WEEK | 1.45590 | .70496 | .01548 | 1.42555 | 1.48625 | 94.076 | 2074 | .749 |
| Pair 3 | ONCE A WEEK – ONCE A WEEK | 1.70734 | .49991 | .01102 | 1.68572 | 1.72896 | 154.897 | 2056 | .621 |
| Pair 4 | ONCE A MONTH – ONCE A MONTH | 1.45976 | .73335 | .01610 | 1.42819 | 1.49133 | 90.674 | 2074 | .274 |
| Pair 5 | LESS THAN ONCE A MONTH – LESS THAN ONCE A MONTH | 1.47130 | .74647 | .01639 | 1.43915 | 1.50345 | 89.741 | 2072 | .592 |
| Pair 6 | NEVER – NEVER | 1.57796 | .61237 | .01343 | 1.55161 | 1.60430 | 117.464 | 2077 | .681 |
| Pair 7 | DURATION OF EXERCISE – DURATION OF EXERCISE | .18444 | .40490 | .00887 | .16704 | .20184 | 20.784 | 2081 | .984 |
The following tables are summarizing the demographics of respondents of the study.
| GUARDIAN’S AGE | |||||
| Frequency | Percent | Valid Percent | Cumulative Percent | ||
| Valid | >55 | 728 | 35.0 | 35.0 | 35.0 |
| 18-35 | 833 | 40.0 | 40.0 | 40.0 | |
| 36-55 | 521 | 25.0 | 25.0 | 100.0 | |
| Total | 2082 | 100.0 | 100.0 | ||
| GUARDIAN’S GENDER | |||||
| Frequency | Percent | Valid Percent | Cumulative Percent | ||
| Valid | FEMALE | 1354 | 65.0 | 65.0 | 65.0 |
| MALE | 728 | 35.0 | 35.0 | 100.0 | |
| Total | 2082 | 100.0 | 100.0 | ||
| GUARDIAN’S NATIONALITY | |||||
| Frequency | Percent | Valid Percent | Cumulative Percent | ||
| Valid | SAUDI | 2082 | 100.0 | 100.0 | 100.0 |
| GUARDIAN’S EDUCATION | |||||
| Frequency | Percent | Valid Percent | Cumulative Percent | ||
| Valid | BACHELOR | 1145 | 55.0 | 55.0 | 55.0 |
| GRADUATE | 312 | 15.0 | 15.0 | 70.0 | |
| HIGH SCH | 625 | 30.0 | 30.0 | 100.0 | |
| Total | 2082 | 100.0 | 100.0 | ||
| MARITAL STATUS | |||||
| Frequency | Percent | Valid Percent | Cumulative Percent | ||
| Valid | MARRIED | 1978 | 95.0 | 95.0 | 95.0 |
| DIVORCED/WIDOWED | 104 | 5.0 | 5.0 | 100.0 | |
| Total | 2082 | 100.0 | 100.0 | ||
| NUMBER OF CHILDREN | |||||
| Frequency | Percent | Valid Percent | Cumulative Percent | ||
| Valid | 1-2 | 666 | 32.0 | 32.0 | 32.0 |
| 3-5 | 1083 | 52.0 | 52.0 | 84.0 | |
| 6-12 | 333 | 16.0 | 16.0 | 100.0 | |
| Total | 2082 | 100.0 | 100.0 | ||
| TYPE OF HOUSING | |||||
| Frequency | Percent | Valid Percent | Cumulative Percent | ||
| Valid | OWNED | 479 | 23.0 | 23.0 | 23.0 |
| RENTED | 1603 | 77.0 | 77.0 | 100.0 | |
| Total | 2082 | 100.0 | 100.0 | ||
| ANNUAL HOUSEHOLD INCOME | |||||
| Frequency | Percent | Valid Percent | Cumulative Percent | ||
| Valid | 10000-19000 | 1749 | 84.0 | 84.0 | 84.0 |
| 20000+ | 333 | 16.0 | 16.0 | 100.0 | |
| Total | 2082 | 100.0 | 100.0 | ||
| EMPLOYMENT STATUS BEFORE COVID | |||||
| Frequency | Percent | Valid Percent | Cumulative Percent | ||
| Valid | EMPLOYED | 2040 | 98.0 | 98.0 | 98.0 |
| UNEMPLOYED | 42 | 2.0 | 2.0 | 100.0 | |
| Total | 2082 | 100.0 | 100.0 | ||
| EMPLOYMENT STATUS AFTER COVID | |||||
| Frequency | Percent | Valid Percent | Cumulative Percent | ||
| Valid | EMPLOYED | 1811 | 87.0 | 87.0 | 87.0 |
| UNEMPLOYED | 271 | 13.0 | 13.0 | 100.0 | |
| Total | 2082 | 100.0 | 100.0 | ||
| ISOLATION STATUS | |||||
| Frequency | Percent | Valid Percent | Cumulative Percent | ||
| Valid | WORKING OUTSIDE HOUSE | 645 | 31.0 | 31.0 | 31.0 |
| SELF ISOLATION | 292 | 14.0 | 14.0 | 45.0 | |
| CLOSE CONTACT ISOLATION | 1145 | 55.0 | 55.0 | 100.0 | |
| Total | 2082 | 100.0 | 100.0 | ||
| FREQUENCY OF OUTDOOR ACTIVITIES | |||||
| Frequency | Percent | Valid Percent | Cumulative Percent | ||
| Valid | DAILY | 416 | 20.0 | 20.0 | 20.0 |
| WEEKLY | 1416 | 68.0 | 68.0 | 88.0 | |
| MONTHLY | 250 | 12.0 | 12.0 | 100.0 | |
| Total | 2082 | 100.0 | 100.0 | ||
The current study was conducted to testify to the hypothesis i.e., there is a significant unhealthy change in eating behavior of children during the pandemic as compared to before the pandemic and a significant change in physical activities before and after the pandemic Cronbach’s alpha value with a magnitude of 0.9 has assured the reliability of the collected data.
The research was conducted in the eastern region of Saudi Arabia and took Saudi nationals as participants of the research 65% female and 35% male responded to the study. At first, demographics have shown about 68% of respondents had limited their outdoor activities on weekly basis during a pandemic.
During, the pandemic 55% of respondents stayed isolated within the premises of their close contacts only, depicting the intensity of anti-social activity. Then t-test has applied to compare the before and during behavior and activity changes in kids, 3-12 years old. Three-quarters of the research had proven the hypothesis.
Highlighting: due to lockdown, most students had left their physical exercise that used to be done in assembly at school. Guardians had reported they had observed insufficient physical activities in their kids during the pandemic. The frequency table has shown 1107 and 502 parents believed their kid’s inappropriate eating behavior caused by boredom and anxiety respectively occurred during covid-19. Similarly, losing interest in eating, frequent eating, slow eating, or affiliating eating with emotions like anger, anxiety, and upset is the response to the change caused by the pandemic.
The swift spread of the pandemic has not disturbed the business cycle and living styles and it has also adversely affected kids’ behavioral changes. Long-term lockdown and social distancing affected their daily routine and brought a significant change in their eating and physical activities. The study was designed to inferentially investigate the change caused by pandemics in their eating patterns and physical activities.
For this purpose, primary research had conducted in Eastern Saudi Arabia by adopting a convenience sampling technique. By implementing a few reservations, a sample size of 2,602 has been designed. Out of which 2,082 respondents participated in the study and came up with a response rate of 80% for the study.
T-test has been applied to analyze the comparison between two situations. Outcomes have shown a significant change in children’s physical activity and eating habits caused by the pandemic. The current study has provided a new dimension to studying the children’s behavioral changes, adoptions, and habits altered by pandemics in the region of Saudi Arabia.
1. Identify research questions and variables.
2. Collect and organize data.
3. Choose appropriate statistical tests (e.g., t-test, ANOVA).
4. Analyze data using statistical software (e.g., SPSS).
5. Interpret results and draw conclusions.
6. Document findings in your dissertation.
You May Also Like
All work is written by human writers. 100% AI free, guaranteed.
100% money back guarantee if you find plagiarism in our work.
COMPANY DETAILS


