Here is a sample that showcases why we are one of the world’s leading academic writing firms. This assignment was created by one of our UK assignment writers and demonstrated the highest academic quality. Place your order today to achieve academic greatness.
Amazon is today known to the world as the most customer-centric innovative organisation till date, creating real value for its consumers through internet. Company has been delivering value and generating huge returns through four binding principles of customer obsession, passionate inventions, long-term vision, and commitment to increasing excellence, rather than competitive focus. This has lead the company achieve 738% aggregate growth (2021: 1,510,000) in customer accounts and 838% revenue growth (2021: $15.7 million) since its establishment in 1997, with operations being organised across three segments, namely “North America”, “International”, and “Amazon Web services (Amazon, 2022). The strategic modification has helped the company achieve a significant market share, and was ranked second in the list of “Best Global Brands Ranking 2021”, in terms of its brand valuation (Interbrand, 2021). Presently, Amazon’s rapidly evolving business model range across several industries, including ecommerce, retail industry, omni-channel retail, electric appliances, digital media, grocery, logistics, web and infrastructure computing services (Watanabe et al., 2021; Nariswari and Nugraha, 2020). Thus, as the company is making entry into new industries and new markets, the intensity of competition is increasing, which is continually intensifying with the development of new business models and entrance of new continually emerging new competitors in those markets. However, the macroeconomic factors in host economies also substantially influence the company’s business. This report gives a comprehensive analysis of Amazon’s financial performance in comparison with one of its closest competitor, Alibaba, and macroeconomic analysis in view of the global industry factors and forces the company is subject to in those markets.
According to Ives, Cossick and Adams (2019), the ecommerce giant’s core strengths revolve around its customer-focus innovation strategy, which proved helpful for it during past twenty five years, especially in surpassing the largest US retail brand, Walmart, in 2015.
Robust performance can be evidenced from the Appendix –I; gross sales arouse by 21.7% during 2021 as compared to prior year. However, the year-on-year percentage rise in revenue was 38% as compared to only 18% rise in 2020, of which 40% sales growth (2020: 22%) relates to the international segment. This means, several factors in those markets impact its operations. According to the annual report 2021, foreign currency fluctuations affected net sales by $3.8billion (2020: $1.4billion). On the other hand, the sales in the North American segment experienced an 18% increase, which reflects increased sales in this market by third party sellers, and advertising sales. However, the supply chain constraints and inefficiencies in the fulfilment network partially mitigated the expected sales growth to be driven from company’s shipping offers and pricing strategies in these two segments (Amazon, 2022).
Third one, the AWS segment endured a 37% increase in sales during fiscal 2021, representing market potential for growth in future years as well. Upward surge in customer usage and effectiveness of cost structure led to overall increase in operating income, however, was partly offset by increased investment into the technology infrastructure, increased payroll costs and price reduction measures. However, these steps are expected to drive greater operating incomes in coming years as well (Amazon, 2022).
In addition to the foreign currency fluctuations, transportation and logistics costs, change in wage rate policies in certain markets, carrier rates, and marketing costs also significantly impact company’s operating profits. Further, changes in consumer preferences or weakening of economies across the world directly influence the company’s revenues.
Operating in a number of economies subject the company to a number of regulations and legislations, particularly the laws regulating use of internet and ecommerce, retail industry, artificial intelligence technology, digital media and other sectors related to company’s operations. For instance, unfavourable legislations or interpretations, inquiries, investigations etc. by host governments can any time increase these risk of heavy monetary fines, civil or criminal liabilities, or impact the demand for Amazon’s products. Major markets, where company faces strict taxation regulations, include large markets such as India, United States, China, United Kingdom, France, Japan etc. Besides, company has faced strong criticism from former US presidents, for its not paying any taxes. There is a continuous threat that the ‘internet tax’, if approved, will substantially influence Amazon’s operating expenses. However, favourable measures or regulations in those markets are likely to bring exponential benefits for Amazon. Best example is the ongoing French Government’s planning, “plan très Haut debit”, regarding acceleration of 4G and deployment of optical fibre networks, which is anticipated to have positive impact of Amazon’s financial performance due to anticipated ease in consumers’ access to internet (Pollet, 2021).
Professional editors proofread and edit your paper by focusing on:

Amazon has been facing cutthroat competition from both existing large players in several sectors, as well as continuously emerging new setups. Besides, many have imitated Amazon’s easily replicable business model, rectified deficiencies therein, and have grown further to compete with Amazon in return. Common examples include Netflix, Barners & Noble, eBay, Oyster etc. Other large competitors offering strong global scale competition to the company, include Tesco, Walmart, Alibaba Group etc. (Bloomberg, 2022).
Amazon has faced severe challenges in numerous markets due to its failure to tailor its offerings in those markets, especially in China (Sang and Ulrich, 2021). As, company’s major competitive advantage relates to its innovative capabilities in the ecommerce sector, Alibaba Group is one of Amazon’s largest competitor in both Chinese market, as well as in the global market. Below is the performance analysis of both ecommerce giants for recent two years:
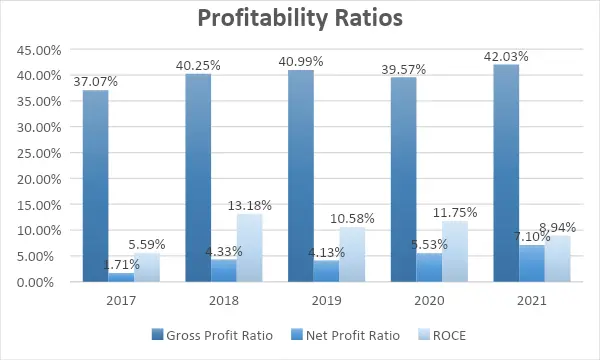
These are the most important and commonly employed financial metrics to analyse and compare the financial performance of any company with historical trends, or close industry rivals (Nariswari and Nugraha, 2020). The gross profit margin for Amazon increased by 2.46% during 2021 as compared to 1.42% decline in 2020. According to the 2020 Annual Report, the North American and International segments experienced increase in demands during pandemic crisis as more people were staying at home, and thus, there was more demand for household products. However, this was offset against supply chain constraints and fulfilment costs, due to impact of reduced productivity, foreign currency fluctuation, rise in staff hiring costs and other workplace safety expenditure in view of virus (Amazon, 2020).
While Amazon’s costs of sales increased by 16.73% during 2021, the largest competitor (Appendix – I), Alibaba Group’s cost of revenue increased by 49% (Alibaba Group, 2021). According to the management explanations, both companies invested significantly in the fulfilment network and endured from increased logistics costs; however, this can be said that Amazon performed relatively better than its competitor in terms of cost management. Also, one may argue in favour of greater investment into fulfilment, that Alibaba Group has a long-term strategic vision, and reinvests profits back into the business to generate greater returns in the future (Ricart, J. and Casadesus-Masanell; Pokorná, Šebestová, and Čemerková, 2019).
Refer to Appendix – III, Amazon’s return on capital employed has been showing continuously fluctuating trends during past five years. Company faced downward trend for this return in 2019, due to unexpected blow during the last quarter of the year due to sudden pandemic outbreak in major markets. However, as the company recovered from this impact and redesigned its pricing and supply chain strategy, there was an increase in the ratio to reach 11.75% in 2020. Likewise, as the company made careful investments into its fulfilment network, the return declined to 8.94%.
On the contrary, net profit ratio has been presenting steadily increasing trend since 2017. This is because, company makes continuous investments into innovative launch of new products and services, and is expanding further into new and existing markets. More specifically, increased GDP growth and disposable incomes in North American segment, leads to continuous increase in demand for company’s electronic products in those markets. Also, more consumers from the developed economies prefer purchasing through online channels, due to which there is continuous increase in net income from ‘International’ and ‘AWS’ segments. Therefore, the established brand name in some large economies contributes to offset against inflationary and other unfavourable economic impacts on Amazon from other economies. Still, Amazon’s net profitability margins seem in line with the average industry trends, but not that of its top competitor, i.e. Alibaba Group (Appendix II, IV).
Despite its moderate diversification strategy and name as a top ecommerce giant, Amazon couldn’t succeed in Chinese market, and could secure barely one percent in this market. This is because of Amazon’s inability to exploit local labour more effectively than the domestic suppliers in China. The Chinese suppliers took advantage of the excess labour availability to leverage their delivery and logistics costs. On the other hand, the foreign suppliers therein, face constraints in the form of Chinese ecommerce and intellectual property laws for foreign companies. Thus, Amazon operates offers services in Indian and Chinese markets through third party sellers and retailers. This increases its costs, and making the operating and net profit margins from international segments significantly lower in these markets despite good demand (Tullman, 2019). This is also one of the area where Alibaba has surpassed Amazon due to market-specific strategic penetration. Also, the rival is earning a significant portion of its net revenues from Chinese market, which alone is a country of more than 1 billion people.
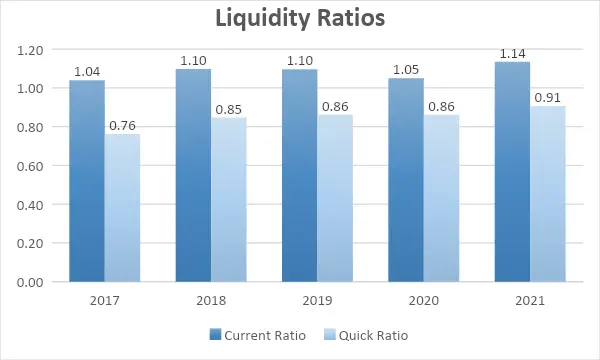
Liquidity ratios are useful financial metrics employed in several industries to assess the efficiency of an entity’s working capital management (Uyar, 2009).
Evident from Appendix II and IV, both Amazon and Alibaba Group’s current ratio is greater than 1, thus representing sufficient ability of their current assets to pay for its current obligations. However, Amazon’s major liquid resources comprise of cash and cash equivalents and marketable securities balances appearing in the balance sheet at fair values. Thus, if we exclude inventories to conduct acid-test or quick ratio, as inventories have the least ability to settle an entity’s liabilities in the event of liquidation. Amazon’s quick ration is below 1, as against Alibaba Group who has both ratios during last two years of greater than 1. This is an alarming situation for Amazon, as inventories constitute a substantial portion of company’s current assets to give a favourable current ratio.
This can also be linked to company’s increasing profitability year on year, as liquidity and profitability are inversely related. This may mean, that management pays-off all profits, either in the form of dividends to shareholders, or reinvests back into the business for generating more future returns. However, this is not a good practice, as company do not maintains enough liquid assets to pay for its current obligations, which may adversely impact its net working capital as well (Lartey, Antwi and Boadi, 2013; Madushanka and Jathurika, 2018).
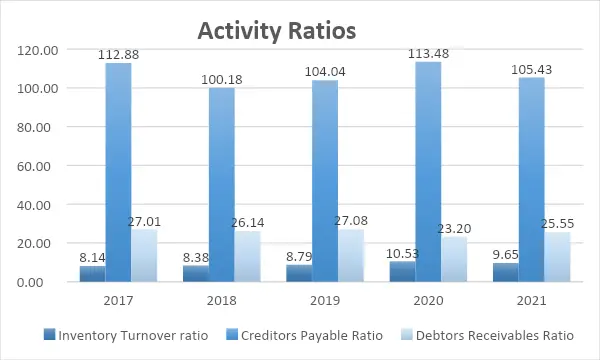
Company has always been maintaining a good inventory turnover ratio, which represents that company’s continuous efforts in respect of pricing strategies and sales have proven successful (Amazon, 2021). According to appendix – IV, this ratio increased steadily till 2020, and fell in 2021, representing that consumers have again moved to physical channels after the removal of government’s lockdown restrictions. In many markets, including United States, United Kingdom, India, and China, customers of several electronic devices and grocery items have shown more preference for emerging small retailers, due to less freight and logistics costs (Amazon, 2022). This directly impacts company’s inventory management practices as well, as there will be more inventory in stores at year-end than expected.
However, creditors’ payable ratio and debtors’ ratios have represented positive movement in line with the industry trends. Major reason behind this similar trend can be that due to removal of lockdown impositions by most of the governments, company was able to pay off its obligations and recover from its debtors as well.
Lastly, the assets turnover ratio point out a positive position at the end of Amazon as compared to its rival company, whose ratio was always below 1. This means, that Amazon is effectively utilising its total assets (including investments) to generate returns for its shareholders. One of the reason is multi-sectorial practice, which helps the company derive profits in several forms, many of which do not require capital investments.
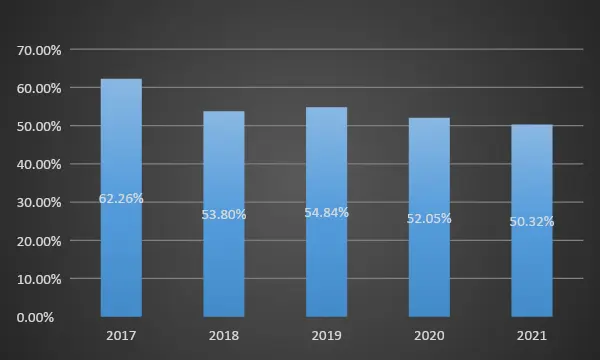
Leverage ratios are useful financial tools, employed to assess a company’s ability to comply with its financial obligations. The Debt-to-Equity ratio was fairly negative in comparison with the industry trends, as company has more preference for external debt obligations as compared to equity. However, this is a non-useful practice as company will have to incur more finance costs, rather than paying dividends. Also, availing external debt options rather than investment from shareholders, has more risks and consequences as well. On the other hand, the rival company is performing relatively better in this area (Pirzada, Mustapha and Wickramasinghe, 2015).
Above insights of company’s financial performance in comparison with its major rival and industry trends, in the light of year-on-year and ratios analysis indicate that Amazon Inc. is quite successful in making a competitive advantage in most of the markets, where it has operations. However, its ability to generate profits and gain competitive advantage over local suppliers is impacted by macroeconomic factors, such as GDP growth in those markets, unemployment levels, disposable incomes of consumers, inflation rate, wage rate policies, and other industry and regulatory requirements by governments.
Alibaba Group, 2020. Fiscal Year 2020 Annual Report. [Online]. Available at: https://doc.irasia.com/listco/hk/alibabagroup/annual/2020/ar2020.pdf [Accessed 11 August 2022].
Alibaba Group, 2021. Fiscal Year 2021 Annual Report. [Online]. Available at: https://doc.irasia.com/listco/hk/alibabagroup/annual/2021/ar2021.pdf [Accessed 11 August 2022].
Amazon, 2020. Annual Report 2020. [Online]. Available at: https://s2.q4cdn.com/299287126/files/doc_financials/2021/ar/Amazon-2020-Annual-Report.pdf [Accessed 11 August 2022].
Amazon, 2022. Annual Report 2021. [Online]. Available at: https://s2.q4cdn.com/299287126/files/doc_financials/2022/ar/Amazon-2021-Annual-Report.pdf [Accessed 11 August 2022].
Bloomberg, 2022. Amazon’s Banned China Sellers Turn to Walmart’s Marketplace. Available at: https://www.bloomberg.com/news/articles/2022-01-26/amazon-s-banned-china-retail-sellers-turn-to-walmart-s-online-marketplace [Accessed 07 July 2022].
Interbrand, 2021. Best Global Brands 2021. Available at: https://interbrand.com/best-global-brands/amazon/ [Accessed 07 July 2022].
Ives, B., Cossack, K. and Adams, D., 2019. Amazon Go: disrupting retail?. Journal of Information Technology Teaching Cases,9(1), pp.2-12.
Lartey, V.C., Antwi, S. and Boadi, E.K., 2013. The relationship between liquidity and profitability of listed banks in Ghana.International Journal of Business and Social Science,4(3).
Madushanka, K.H.I. and Jathurika, M., 2018. The impact of liquidity ratios on profitability.International Research Journal of Advanced Engineering and Science,3(4), pp.157-161.
Nariswari, T.N. and Nugraha, N.M., 2020. Profit growth: impact of net profit margin, gross profit margin and total assets turnover.International Journal of Finance & Banking Studies (2147-4486),9(4), pp.87-96.
Pirzada, K., Mustapha, M.Z.B. and Wickramasinghe, D., 2015. Firm performance, institutional ownership and capital structure: A case of Malaysia.Procedia-Social and Behavioral Sciences,211, pp.170-176.
Pokorná, P., Šebestová, J. and Čemerková, Š., 2019. Dilemma of Directions for reinvestment. InForum Scientiae Oeconomia, 7(4), pp. 83-99.
Pollet, M., 2021. French senators welcome 4G deployment strategy, bemoan not being involved. Euractiv. Available at: https://www.euractiv.com/section/digital/news/french-senators-welcome-4g-deployment-strategy-bemoan-not-being-involved/ [Accessed 12 July 2022].
Ricart, J. and Casadesus-Masanell, R., 2011. How to design a winning business model.Harvard business review,89(1-2), pp.100-107.
Ritala, P., Golnam, A. and Wegmann, A., 2014. Coopetition-based business models: The case of Amazon.com.Industrial marketing management,43(2), pp.236-249.
Sang, L. and Ulrich, K., 2021.Winning in China: 8 Stories of Success and Failure in the World’s Largest Economy. University of Pennsylvania Press.
Tullman, H., 2019. Amazon’s Amazing Failure in China: Why was the world’s best e-tailer unable to establish a domestic presence in a market that seemed made for it? Because it couldn’t exploit labour enough. Inc. Available at: https://www.inc.com/howard-tullman/chinas-amazing-failure-in-china.html [Accessed 11 August 2022].
Uyar, A., 2009. The relationship of cash conversion cycle with firm size and profitability: an empirical investigation in Turkey.International research journal of finance and economics,24(2), pp.186-193.
Watanabe, C., Akhtar, W., Tou, Y. and Neittaanmäki, P., 2021. Amazon’s new supra-omni-channel: realizing growing seamless switching for apparel during COVID-19.Technology in Society,66, p.101645.
Appendix – I: Horizontal Analysis of Income Statement of Amazon Inc.
| 2021($) | 2020($) | Variance($) | Increase/
Decrease (%) |
||
| Sales: | |||||
| Net Product Sales | $ 241,787 | $ 215,915 | $25,872 | 11.98% | |
| Net Service Sales | $ 228,035 | $ 170,149 | $57,886 | 34.02% | |
| Total net sales | $ 469,822 | $ 386,064 | $83,758 | 21.70% | |
| Operating expenses: | |||||
| Cost of sales | 272,344 | 233,307 | $39,037 | 16.73% | |
| Fulfilment | 75,111 | 58,517 | $16,594 | 28.36% | |
| Technology and content | 56,052 | 42,740 | $13,312 | 31.15% | |
| Marketing | 32,551 | 22,008 | $10,543 | 47.91% | |
| General and administrative | 8,823 | 6,668 | $2,155 | 32.32% | |
| Other operating expense (income), net | 62 | (75) | $137 | -182.67% | |
| Total operating expenses | 444,943 | 363,165 | $81,778 | 22.52% | |
| Operating income | 24,879 | 22,899 | $1,980 | 8.65% | |
| Interest income | 448 | 555 | -$107 | -19.28% | |
| Interest expense | (1,809) | (1,647) | -$162 | 9.84% | |
| Other income (expense), net | 14,633 | 2,371 | $12,262 | 517.17% | |
| Total non-operating income (expense) | 13,272 | 1,279 | $11,993 | 937.69% | |
| Income before income taxes | 38,151 | 24,178 | $13,973 | 57.79% | |
| Provision for income taxes | (4,791) | (2,863) | -$1,928 | 67.34% | |
| Equity-method investment activity, net of tax | 4 | 16 | -$12 | -75.00% | |
| Net income | $ 33,364 | $ 21,331 | $12,033 | 56.41% |
Appendix – II: Financial Ratios Analysis of Amazon Inc.
| Category | Ratios | Formulae | 2021 | 2020 | |||||
| Net Sales | 469,822 | 386,064 | |||||||
| Net Profit Ratio | Net Profit | x100 | 33,364 | x100 | 7.10% | 21,331 | x100 | 5.53% | |
| Net Sales | 469,822 | 386,064 | |||||||
| ROCE | EBIT | x100 | 24,879 | = | 0.09 | 22,899 | = | 0.12 | |
| Net capital employed | 278,283 | 194,810 | |||||||
| Operating Profit Ratio | Operating Profit | x100 | 49,758 | = | 0.11 | 45,798 | = | 0.12 | |
| Net Sales | 469,822 | 386,064 | |||||||
| Liquidity Ratios | Current Ratio | Current Assets | 161,580 | = | 1.14 | 132,733 | = | 1.05 | |
| Current Liabilities | 142,266 | 126,385 | |||||||
| Quick Ratio | Current Assets – Inventory | 161,580-32,640 = | 0.91 | 132733-23795 = | =0.862 | ||||
| Current Liabilities | 142,266 | 126,385 | |||||||
| Activity Ratios | Inventory Turnover ratio | Cost of Sales | 272,344 | = | 9.65 | 233,307 | = | 10.53 | |
| Average Inventory | (32,640+23,795)/2 | (23,795+20,816)/2 | |||||||
| Asset Turnover Ratio | Sales | 469,822 | = | 1.27 | 386,064 = | 1.41 | |||
| Average total assets | (420,549+321,195)/2 | (321,195+225,248)/2 | |||||||
| Leverage Ratio | Gearing Ratio | Total debt | 282,304 | = | 2.04 | 227,791 | = | 2.44 | |
| Shareholders’ Equity | 138,245 | 93,404 | |||||||
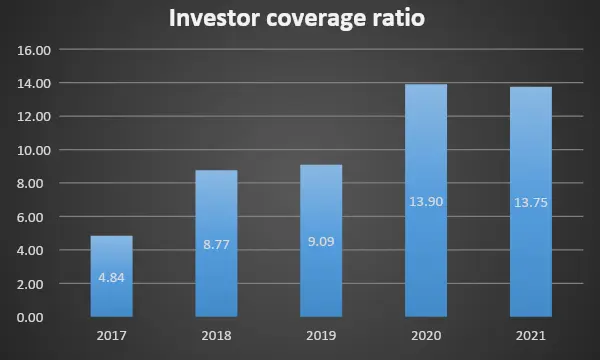
| Investor coverage | EBIT | 24,879 | = | 13.75 | 22,899 | = | 13.90 | ||
| Interest Expense | 1,809 | 1,647 | |||||||
Appendix – III: Five year Ratios Analysis summary for Amazon Inc.
| Category | Ratios | 2017 | 2018 | 2019 | 2020 | 2021 |
| Profitability Ratios | Gross Profit Ratio | 37.07% | 40.25% | 40.99% | 39.57% | 42.03% |
| Net Profit Ratio | 1.71% | 4.33% | 4.13% | 5.53% | 7.10% | |
| ROCE | 0.06 | 0.13 | 0.11 | 0.12 | 0.09 | |
| Liquidity Ratios | Current Ratio | 1.04 | 1.1 | 1.1 | 1.05 | 1.14 |
| Quick Ratio | 0.76 | 0.85 | 0.86 | 0.86 | 0.91 | |
| Activity Ratios | Inventory Turnover ratio | 8.14 | 8.38 | 8.79 | 10.53 | 9.65 |
| Creditors Payable Ratio | 112.88 | 100.18 | 104.04 | 113.48 | 105.43 | |
| Debtors Receivables Ratio | 27.01 | 26.14 | 27.08 | 23.2 | 25.55 | |
| Leverage Ratio | Gearing Ratio | 62.26% | 53.80% | 54.84% | 52.05% | 50.32% |
| Investor cover | 4.84 | 8.77 | 9.09 | 13.9 | 13.75 |
Profitability Ratios:
Liquidity Ratios:
Activity Ratios:
Leverage Ratios – Gearing Ratio:
Interest Cover:
Appendix – IV: Ratios Analysis for Alibaba Group
| Category | Ratios | Formulae | 2021 | 2020 | ||
| Profitability Ratios | Gross Profit Ratio | Gross Profit x 100 | 296,084 | 41.28% | 227,344 | 44.60% |
| Net Sales | 717,289 | 509,711 | ||||
| Net Profit Ratio | Net Profit x 100 | 143,284 | 19.98% | 140,350 | 27.54% | |
| Net Sales | 717,289 | 509,711 | ||||
| ROCE | EBIT x 100 | 177,038 | 0.13 | 166,092 | 0.16 | |
| Net capital employed | 1,312,860 | 1,071,113 | ||||
| Operating Profit Ratio | Operating Profit x 100 | 49,758 | 0.11 | 45,798 | 0.09 | |
| Net Revenue | 469,822 | 509,711 | ||||
| Liquidity Ratios | Current Ratio | Current Assets | 643,360 | 1.70 | 462,923 | 1.91 |
| Current Liabilities | 377,358 | 241,872 | ||||
| Quick Ratio | Current Assets – Inventories | 643,360-27,858 | 1.63 | 462,923-14,859 | 1.85 | |
| Current Liabilities | 377,358 | 241,872 | ||||
| Activity Ratios | Inventory Turnover ratio | Cost of Revenue | 421,205 | 19.72 | 282,367 | 24.14 |
| Average Inventory | (27,858+14,859)/2 | (14,859+8,534)/2 | ||||
| Asset Turnover Ratio | Sales | 717,289 | 0.48 | 509,711 | 0.45 | |
| Average total assets | (1,690,218+1,312.985)/2 | (1,312,985+965,076)/2 | ||||
| Leverage Ratio | Gearing Ratio | Total debt | 606,584 | 0.56 | 433,334 | 0.49 |
| Shareholders’ Equity | 1,083,634 | 879,651 | ||||
| Investor cover | EBIT | 177,038 | 39.55 | 166,092 | 32.06 | |
| Interest Expense | 4,476 | 5,180 | ||||
The report primarily focuses on analyzing Amazon’s financial performance, strategic innovations, and its competitive positioning against Alibaba, considering various macroeconomic factors influencing the company’s operations.
You May Also Like

All work is written by human writers. 100% AI free, guaranteed.

100% money back guarantee if you find plagiarism in our work.
COMPANY DETAILS


