In research, variables are the key elements that researchers study, measure, or manipulate to understand relationships or test hypotheses.
A variable is anything that can change or vary during a study, such as age, income, temperature, or level of satisfaction. For example, if you are researching how study hours affect exam scores, study hours and exam scores are both variables.
There are several main types of variables in research, including:
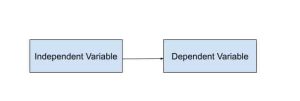
Some studies also include extraneous, confounding, or moderator variables depending on the research design.For example, in a study exploring the impact of exercise on weight loss, exercise is the independent variable, while weight loss is the dependent variable.
Here is why variables are important in research.
Below is a breakdown of the primary variable types:
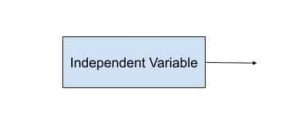
The independent variable is the factor that researchers deliberately change or manipulate to observe its effect on another variable. It is considered the cause in a cause-and-effect relationship.
In marketing research, a project could analyse how advertising spend influences brand sales performance.
What factor is being changed or controlled by the researcher? The independent variable is always the variable that influences or predicts a change in another variable.
The dependent variable is the outcome or result that researchers observe and measure. It shows the effect of the change in the independent variable.
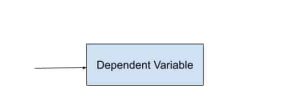
The dependent variable depends on the independent variable. For example, if the study examines how diet (independent variable) influences cholesterol levels (dependent variable), changes in diet will likely impact cholesterol readings.
Controlled variables are factors kept constant throughout the study to ensure that only the independent variable affects the results. They help maintain fairness and accuracy in experiments. Moreover,
Extraneous variables are any external factors that might influence the dependent variable but are not intentionally studied.
Confounding variables are a specific type of extraneous variable that changes systematically with the independent variable, making it difficult to determine which variable caused the effect.
Both can distort results and lead to false conclusions. Additionally, they reduce the internal validity of an experiment if not appropriately controlled. You can manage these variables through the following:
Our writers are ready to deliver multiple custom topic suggestions straight to your email that aligns
with your requirements and preferences:
Now we will discuss some other types of variables that are important in research.
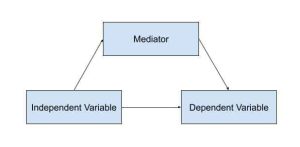
A moderator variable affects the strength or direction of the relationship between an independent and a dependent variable. It does not cause the relationship but changes how strong or weak it appears.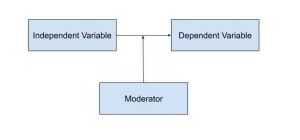
A mediator variable explains how or why an independent variable influences a dependent variable. It serves as a middle link that clarifies the process of the relationship.
| Categorical Variables | Continuous Variables |
| These variables represent groups or categories that have no inherent numerical meaning. They are used to classify data. | These variables can take an infinite number of values within a given range and are measurable on a scale. |
| Examples: Gender (male/female), blood type (A, B, AB, O), or employment status (employed/unemployed). | Examples: Height, weight, income, or temperature. |
| Quantitative Variables | Qualitative Variables |
| These involve numerical data that can be measured or counted. | These describe non-numeric characteristics or qualities. |
| Examples: Number of products sold, test scores, or age in years. | Examples: Hair colour, customer feedback, or political opinion. |
| Discrete Variables | Continuous Variables |
| These are countable variables that take specific, separate values with no in-between. | These can take any value within a given range and can include fractions or decimals. |
| Examples: Number of students in a class, number of cars in a parking lot, or number of children in a family. | Examples: Time taken to complete a task, body weight, or temperature. |
Here is a process explanation to find variables in your research problem:
1. Research title: The impact of hours of study on undergraduate exam performance.
| Independent variable | Hours of study per week (continuous; measured in hours). |
| Dependent variable | Exam performance (continuous; measured as percentage score on the final exam). |
| Controlled variables | Course level, instructor, and exam difficulty. |
| Possible confounder | Prior GPA (may need to be controlled or included as a covariate). |
2. Research title: Effect of daily 10 mg antihypertensive medication on systolic blood pressure
| Independent variable | Medication dosage (categorical/ controlled: 10 mg vs placebo). |
| Dependent variable | Systolic blood pressure (continuous; mmHg measured at clinic visits). |
| Controlled variables | Measurement time, cuff size, and patient posture. |
| Possible confounder | Patient adherence to medication (monitor or measure). |
3. Research title: How social support moderates the relationship between work stress and burnout among nurses
| Independent variable | Work stress (quantitative; score on validated stress scale). |
| Dependent variable | Burnout (quantitative; score on Maslach Burnout Inventory). |
| Controlled variables | Social support (quantitative; score on social support scale). |
| Possible confounder | Shift type, years of experience, department. |
4. Research title: The role of advertising spend in increasing online sales across peak and off-peak seasons
| Independent variable | Advertising spend per week (continuous; USD). |
| Dependent variable | Online sales (continuous; weekly revenue USD). |
| Moderator variable | Seasonality (categorical: peak vs off-peak). |
| Controlled variables | Price, product range, website downtime. |
| Possible confounder | Promotional discounts (track and control). |
An independent variable is the factor that a researcher changes, manipulates, or controls to observe its effect on another variable. It is considered the cause in a cause-and-effect relationship.
Example: In a study on how study time affects exam scores, study time is the independent variable.
A control variable is a factor that is kept constant throughout an experiment to ensure that only the independent variable influences the results. It helps maintain the accuracy and fairness of the study.
Example: In a plant growth experiment, soil type and amount of sunlight are control variables.
A variable in research is any element, trait, or condition that can change or vary within a study. Variables can be measured, manipulated, or controlled to test hypotheses and identify relationships between factors.
Example: Age, income, motivation, and temperature are all examples of variables.
A dependent variable is the outcome that researchers measure in response to changes in the independent variable. It represents the effect or result of the experiment.
Example: In a study on the effect of exercise on weight loss, weight loss is the dependent variable.
Most investigations have one independent variable to keep the experiment simple and to identify cause and effect clearly. However, more complex studies may include two or more independent variables if the researcher wants to study how multiple factors interact.
A confounding variable is an outside factor that affects both the independent and dependent variables, making it hard to determine which variable actually caused the change.
Example: When studying the relationship between exercise and weight loss, diet could be a confounding variable since it also influences weight.
The dependent variable is measured each time the independent variable changes. It shows how the manipulation of the independent variable affects the outcome.
A scientific variable is any measurable factor, condition, or characteristic that can exist in different amounts or types during a scientific study. Scientists use variables to test hypotheses and establish cause-and-effect relationships
The independent variable is always plotted on the x-axis (horizontal axis) in a graph. It represents the factor that is changed or controlled by the researcher.
The dependent variable is plotted on the y-axis (vertical axis). It represents the outcome or effect that changes in response to the independent variable.
A random variable is a variable whose values result from random events or chance. It can take different outcomes depending on the probabilities of those events.
Example: The number of heads when flipping a coin five times is a random variable.

All work is written by human writers. 100% AI free, guaranteed.

100% money back guarantee if you find plagiarism in our work.
COMPANY DETAILS


