The standard error (SE) is a statistical measure that shows how much a sample estimate, like the sample mean, is expected to vary from the actual population value.
Simply put, it tells you how precise your sample results are. A smaller standard error means your sample is giving a more accurate reflection of the population.
The standard error is the measure of how much your sample estimate would change if you repeated the study many times. Think of it as the average difference between the sample mean and the true population mean. The smaller the standard error, the more stable and reliable your sample results are.
Standard error is directly linked to the sampling distribution, which is a theoretical distribution that shows all possible values a sample statistic can take when you repeatedly draw samples from the same population. The spread of this sampling distribution is what creates the standard error.
SE decreases as sample size increases. Larger samples tend to be more representative of the population, so the standard error becomes smaller. This is why studies with small samples often have higher uncertainty.
Some of the most important formulas that you need to remember are listed below:
The most common form is the standard error of the mean (SEM), which shows how much the sample mean varies from the true population mean.
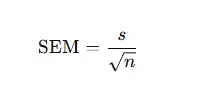
Where:
A larger standard deviation increases SEM, while a larger sample size decreases it.
Used when analysing categorical data, especially in surveys or polls.
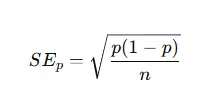
Where:
If the sample size increases or the proportion becomes more stable, SE becomes smaller.
Our writers are ready to deliver multiple custom topic suggestions straight to your email that aligns
with your requirements and preferences:
Here is a simple step-by-step method to help you understand the calculation of how to calculate standard error.
Example dataset: 5, 7, 8, 9, 6
Mean = (5 + 7 + 8 + 9 + 6) ÷ 5 = 7
Standard deviation for this dataset ≈ 1.58
(You can calculate manually or use a calculator/Excel.)
SE = s/n
Where:
SE = 1.585 =0.71
The standard error of the mean = 0.71.
Why SE is linked to standard deviation?
Standard error is built directly from the standard deviation. If your data has high variability (high SD), the SE will also be larger. Similarly, as your sample size increases, the denominator grows, making SE smaller. This is why researchers prefer larger samples.
Standard error comes in several forms depending on the type of data and statistical analysis you are performing. Each type measures the uncertainty in a different kind of sample statistic.
This is the most commonly used standard error. It measures how much the sample mean differs from the true population mean. It is used when:
This is used for categorical data where outcomes are represented as proportions or percentages, such as survey results. You can use it when:
In regression analysis, each coefficient (slope, intercept) has its own standard error. It measures how much the estimated coefficient would vary across repeated samples.
| Standard Deviation (SD) | Standard Error (SE) | |
|---|---|---|
| Conceptual Meaning | Measures how spread out the individual data points are. | Measures how much the sample statistic (usually the mean) varies across repeated samples. |
| What It Tells You | Shows how inconsistent or dispersed your dataset is. | Shows how reliable or accurate your sample mean is. |
| Interpretation Shortcut | SD = variability in data. | SE = accuracy of the estimate. |
| When to Use |
|
|
| Why They Get Confused | Both look similar mathematically. SD measures spread in raw data, while SE measures spread in sample estimates. SE ≈ SD ÷ √n. |
Most students and researchers prefer using statistical software to calculate the standard error because it saves time and reduces calculation mistakes. Here is a quick guide on how to find SE in the most commonly used tools: Excel, SPSS, R, and Python.
Excel does not have a direct built-in function called STANDARDERROR, but you can calculate SE easily using the formula for SEM.
Use: =STDEV.S(range)/SQRT(COUNT(range))
Example: =STDEV.S(A1:A10)/SQRT(COUNT(A1:A10))
SPSS automatically computes standard errors as part of descriptive and inferential statistics.
SPSS also provides standard errors for regression coefficients under: Analyse → Regression → Linear.
R makes it easy to calculate SE with a simple formula.
data <- c(5,7,8,9,6)
se <- sd(data) / sqrt(length(data))
model <- lm(y ~ x, data = df)
summary(model)
The output includes Std. Error for each coefficient.
Using libraries like NumPy and SciPy, Python can calculate SE accurately.
import numpy as np
data = np.array([5,7,8,9,6])
se = np.std(data, ddof=1) / np.sqrt(len(data))
import statsmodels.api as sm
model = sm.OLS(y, sm.add_constant(x)).fit()
print(model.summary())
When manual calculation is preferred?
Standard error is a measure of how much a sample statistic, usually the mean, is expected to vary from the true population value. It shows how precise or accurate your sample results are.
A small standard error means your sample mean is close to the actual population mean. It shows high precision and suggests your sample is more reliable.
Standard deviation measures the spread of raw data values, while standard error measures the spread of sample estimates. SD describes variability in data; SE describes the accuracy of the sample mean.
Use standard error when constructing confidence intervals, running hypothesis tests, comparing sample means, or reporting results in research papers. Use standard deviation when describing how spread out your dataset is.
Standard error decreases with larger sample sizes because bigger samples more accurately represent the population. The formula divides by √n, meaning the larger n becomes, the smaller the SE gets.
There is no universal “good” SE value. A smaller SE is generally better because it indicates higher precision, but the acceptable value depends on the field, sample size, and research context.
Use this formula: =STDEV.S(range)/SQRT(COUNT(range))
Or use the Data Analysis Toolpak → Descriptive Statistics to automatically generate the SE.
No. Standard error can apply to proportions, regression coefficients, differences between means, and other sample statistics. The type of SE depends on what is being estimated.
Researchers report standard error to show how precise their sample estimates are. It helps readers understand the reliability of the results and interpret confidence intervals and hypothesis tests.

All work is written by human writers. 100% AI free, guaranteed.

100% money back guarantee if you find plagiarism in our work.
COMPANY DETAILS


