In research, hypothesis testing serves as a bridge between data and decision-making. It ensures that conclusions are backed by evidence, not assumptions.
What is hypothesis testing?
Hypothesis testing is a statistical method used to make decisions or draw conclusions about a population based on sample data. In simple terms, it helps researchers determine whether the observed results are due to chance or represent real effects.
For example, if a company introduces a new marketing campaign, hypothesis testing can help determine whether the campaign actually increased sales or whether the observed improvement was due to random variation.
In data analysis and academic research, hypothesis testing helps:
Before conducting any hypothesis test, it is important to understand the fundamental terms and concepts used in statistical inference.
| Population | The entire group that you want to study or draw conclusions about. |
| Sample | A smaller subset of the population that represents it. |
Example: If a researcher wants to know the average height of university students, all students in the population form the sample, and 100 randomly selected students form the sample.
| Parameter | A measurable characteristic of a population (e.g., population mean μ). |
| Statistic | A measurable characteristic of a sample (e.g., sample mean x̄). |
| Null Hypothesis (H₀) | The assumption that there is no effect or no difference. | e.g., The new drug has no effect on blood pressure. |
| Alternative Hypothesis (H₁ or Ha) | The statement that contradicts the null, suggesting that an effect or difference does exist. | e.g., The new drug lowers blood pressure. |
| Type I Error (α) | Rejecting a true null hypothesis (a false positive). | e.g., Concluding a new medicine works when it doesn’t. |
| Type II Error (β) | Failing to reject a false null hypothesis (a false negative). | e.g., Missing a real effect and assuming the medicine doesn’t work when it actually does. |
The level of significance represents the threshold for rejecting the null hypothesis, commonly set at 0.05 (5%).
It means there’s a 5% chance of making a Type I error (rejecting a true null).
If the p-value is less than α, the result is considered statistically significant, indicating evidence against the null hypothesis.
Our writers are ready to deliver multiple custom topic suggestions straight to your email that aligns
with your requirements and preferences:
Here is a simple process you can follow to perform hypothesis testing effectively.
The first step is to clearly define the research question: what do you want to find out?
Then, translate it into two hypotheses:
Example:
Choosing the correct statistical test depends on your data type and research design:
| t-test | Comparing means between two groups. |
| Z-test | Used for large samples with known population variance. |
| ANOVA | Comparing means among three or more groups. |
| Chi-square test | Testing relationships between categorical variables. |
| Regression test | Evaluating the effect of one or more variables on an outcome. |
Before analysing data, set your significance level (α), typically 0.05 (5%). This means you are willing to accept a 5% chance of making a Type I error (rejecting a true null hypothesis).
A smaller α (like 0.01) makes your test stricter, while a higher α increases the chance of detecting real effects but also raises false positives.
Once the data is collected, use statistical formulas or software (like SPSS, Excel, or Python) to calculate the test statistic (e.g., t, z, F, or χ²) and the p-value.
Compare the p-value to your chosen significance level (α):
Finally, interpret the results in the context of your research question.
Example: The p-value was 0.03, which is less than 0.05. Therefore, we reject the null hypothesis and conclude that the new teaching method significantly improves student performance.
Remember, statistical significance does not always mean practical significance. You have to interpret results with caution and context.
There are several types of hypothesis testing methods, each designed for different data types and research objectives. These can be broadly categorised into parametric and non-parametric tests.
Parametric tests assume that the data follow a specific distribution (usually normal) and meet certain conditions, such as equal variances and interval-level measurements. Some common tests include the following:
Non-parametric tests are used when the data doesn’t meet normal distribution assumptions or when dealing with ordinal or categorical variables.
Common non-parametric tests include chi-square test and the following:
| Mann-Whitney U test | To compare differences between two independent groups. |
| Kruskal-Wallis test | A non-parametric alternative to ANOVA for comparing multiple groups. |
| One-Tailed Test | Two-Tailed Test |
|---|---|
| Predicts the direction of the effect (e.g., “Group A will have higher scores than Group B”). | Tests for any difference, regardless of direction (e.g., “Group A and Group B will have different scores”). |
The p-value is one of the most important yet misunderstood concepts in hypothesis testing. It helps you decide whether your findings are statistically significant or if they occurred by random chance.
The p-value (probability value) measures the likelihood of observing your sample results, or something more extreme, assuming that the null hypothesis (H₀) is true.
In simpler terms, the p-value tells you how compatible your data is with the null hypothesis.
The interpretation of the p-value depends on the significance level (α) you have set:
| p-value | Interpretation | Decision |
|---|---|---|
| p ≤ 0.05 | Strong evidence against H₀ | Reject H₀ |
| p > 0.05 | Weak evidence against H₀ | Fail to reject H₀ |
Suppose you are testing whether a new study technique improves student scores.
Since 0.02 < 0.05, you reject the null hypothesis, concluding that the new technique significantly improves scores.
| p-value | Confidence Interval (CI) | |
|---|---|---|
| Definition | Probability of observing the data if H₀ is true | Range of values likely to contain the true population parameter |
| Focus | Significance testing | Estimation of effect size |
| Decision Basis | Compared to α (e.g., 0.05) | Whether the interval includes the null value (e.g., 0) |
| Example | p = 0.03 → Reject H₀ | 95% CI does not include 0 → Reject H₀ |
Below are the most commonly used statistical tests.
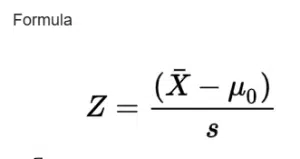
The Z-test is used when the sample size is large (n > 30) or the population variance is known. It compares the sample mean to the population mean.
Example:
A manufacturer wants to know if the average weight of its cereal boxes differs from 500g. Using a Z-test, they can test whether the difference is statistically significant.
The t-test is used when the sample size is small (n < 30) or the population standard deviation is unknown. It’s one of the most commonly applied tests in research.
Example:
A researcher tests whether students’ average exam scores improved after a new training program using a paired t-test.
The chi-square test is a non-parametric test used to determine whether there is a significant relationship between categorical variables.
Example:
A marketing analyst tests whether gender is related to product preference (e.g., men vs. women choosing between two brands).
If the p-value is below 0.05, the analyst concludes that the preference is significantly associated with gender.
Formula:
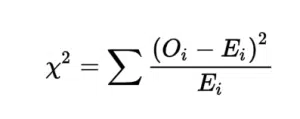
Where O = observed frequency and E = expected frequency.
ANOVA is used when comparing the means of three or more groups to see if at least one group differs significantly.
Example:
A company tests three different training programs to see which one improves employee productivity the most. ANOVA determines if there’s a statistically significant difference among the programs.
If ANOVA shows significance, researchers perform post-hoc tests (like Tukey’s) to identify which groups differ.
Regression analysis is used to test hypotheses about the relationship between one dependent variable and one or more independent variables.
Example:
An economist tests whether education level (independent variable) predicts income level (dependent variable).
If the regression coefficient’s p-value < 0.05, it means education significantly influences income.
Regression-based hypothesis testing is fundamental in predictive modelling, business analytics, and social science research.
| Hypothesis Testing. | Confidence Interval | |
|---|---|---|
| Purpose | To test a claim or assumption about a population parameter. | To estimate a range of possible values for a population parameter. |
| Focus | Decision-making (reject or fail to reject H₀). | Estimation (gives a range of plausible values). |
| Output | p-value and conclusion about significance. | A numerical range (e.g., 95% CI: 4.2–6.8). |
| Interpretation | If p ≤ 0.05, reject the null hypothesis. | If interval excludes the null value (e.g., 0), the result is significant. |
| When to Use | When testing a hypothesis or claim. | When estimating and understanding the precision of results. |
| Insight Provided | Whether an effect exists. | How large or precise the effect is. |
Hypothesis testing is a statistical method used to make decisions or draw conclusions about a population based on sample data. It helps determine whether an observed effect or difference is real or occurred by chance.
The null hypothesis (H₀) assumes no effect or difference exists, while the alternative hypothesis (H₁) suggests that an effect or difference does exist. Hypothesis testing determines whether there’s enough evidence to reject the null hypothesis.
A p-value measures the probability of obtaining the observed data (or something more extreme) if the null hypothesis is true.
Hypothesis testing is used to decide whether to reject a hypothesis, while confidence intervals estimate a range of possible values for a parameter. If the null value lies outside the confidence interval, the hypothesis test would typically reject H₀.
Hypothesis testing provides a structured, evidence-based method to validate assumptions and support conclusions. It helps ensure that results are not due to random chance, improving the credibility and accuracy of research findings.
Use hypothesis testing when you want to make data-driven decisions or verify assumptions about a population, such as comparing group means, testing treatment effects, or analysing relationships between variables.
You May Also Like

All work is written by human writers. 100% AI free, guaranteed.

100% money back guarantee if you find plagiarism in our work.
COMPANY DETAILS


