A statistical test simply helps you understand whether your results are meaningful or just happened by chance. When you pick the correct test, your findings become accurate, reliable, and easier to defend.
Many students struggle with test selection because there are so many options, such as t-tests, ANOVA, chi-square, correlation, regression, and more.
A statistical test is a method used to analyse data and check whether a pattern, difference, or relationship is real. It basically tells you if your research results are strong enough to trust.
Researchers use statistical tests when they want to:
Selecting the correct statistical test is crucial because it directly affects the validity and credibility of your research. The wrong test can lead to misleading conclusions, incorrect interpretations, and weak results. Moreover, it helps you:
Picking the right statistical test becomes easy when you follow a structured approach. Whether you are writing a dissertation, analysing survey data, or working on a research project, these steps help you quickly narrow down the correct test.
The first step is to understand what you want to find out. Are you comparing groups? Testing relationships? Predicting an outcome?
Your research question determines the direction of your statistical analysis.
Identify the type of data you are working with:
Different tests are designed for different numbers of groups. For example, t-tests compare two groups, while ANOVA compares three or more. Ask yourself:
Check if your data is normally distributed.
Determine whether your groups are:
For example:
Your choice depends on:
Parametric tests are more powerful but require assumptions.
Non-parametric tests are safer when assumptions are not met.
Finally, pick a test based on what you want to achieve:
Our writers are ready to deliver multiple custom topic suggestions straight to your email that aligns
with your requirements and preferences:
These two categories are based on the assumptions your data meets.
Use parametric tests when your data is normally distributed and meets the required assumptions. These tests are more powerful and provide stronger statistical results when the conditions are met. Parametric tests require:
| Normality | Data must follow a normal distribution |
| Equal variances | (Homogeneity of variance) between groups |
| Interval or ratio data | Numerical values with meaningful differences |
If your data satisfies these requirements, parametric tests give clearer and more accurate conclusions.
Use non-parametric tests when your data does not meet parametric assumptions or is measured on an ordinal or categorical scale. They are ideal for:
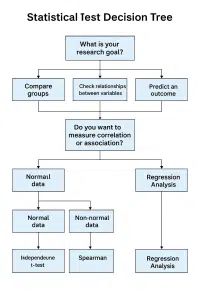
Here is a text-based decision tree to guide you:
| Goal | Data Type | Normal | Test to Use |
|---|---|---|---|
| Compare 2 independent groups | Continuous | Yes | Independent t-test |
| Compare 2 independent groups | Continuous | No | Mann–Whitney U |
| Compare 3+ groups | Continuous | Yes | ANOVA |
| Compare 3+ groups | Continuous | No | Kruskal–Wallis |
| Compare paired data | Continuous | Yes | Paired t-test |
| Compare paired data | Continuous | No | Wilcoxon signed-rank |
| Correlation | Continuous | Yes | Pearson |
| Correlation | Continuous | No | Spearman |
| Association | Categorical | — | Chi-square |
| Prediction | Continuous/categorical | — | Regression |
These tests help you compare mean scores or distributions across groups to see if the differences are statistically significant.
A t-test is a parametric test used when comparing mean values of continuous data. It is ideal when your data is normally distributed.
Used to compare the means of two independent groups.
Example: A dissertation comparing exam scores of male and female students to check if gender affects academic performance.
Used when comparing two related measurements from the same participants.
Example: A study measuring stress levels before and after a mindfulness training programme.
Used to compare the mean of one group to a known or expected value.
Example: A research paper testing whether the average height of a sample of athletes differs from the national average.
ANOVA is used when comparing three or more groups. It checks whether there are significant differences between group means.
Used to compare three or more independent groups based on one factor.
Example: Comparing customer satisfaction levels across three different stores of the same brand.
Used to compare groups based on two different independent variables.
Example: Investigating how gender (male/female) and training type (A/B) together affect employee performance.
Used when the same participants are measured multiple times (similar to paired t-test but with more than two measurements).
Example: Testing blood pressure at three stages: before treatment, mid-treatment, and post-treatment.
A non-parametric alternative to the independent samples t-test. Used when data is non-normal or measured on an ordinal scale.
Example: Comparing satisfaction scores (ranked 1–5) between online shoppers and in-store shoppers.
A non-parametric alternative to the paired t-test. Used when related samples are non-normal or ordinal.
Example: A dissertation comparing pre-test and post-test scores for a small group of participants after an intervention programme.
A non-parametric alternative to one-way ANOVA. Used for comparing three or more independent groups.
Example: Comparing job satisfaction rankings across employees from three different departments.
A non-parametric alternative to repeated-measures ANOVA. Used when the same participants are measured under three or more conditions with non-normal or ordinal data.
Example: Testing user experience scores for three versions of a website interface (Version A, B, and C) using the same group of participants.
These tests help determine whether two variables are connected and how strong that connection is.
Correlation tests measure the strength and direction of a relationship between two variables.
Used when both variables are continuous and normally distributed.
Example: Checking whether hours studied are related to exam scores among university students.
Used when data is non-normal, ordinal, or skewed.
Example: Examining the relationship between job satisfaction rankings and employee performance ratings.
Ideal for small samples or data with many tied ranks.
Example: Studying the relationship between customer preference rankings and product quality ratings in a small pilot study.
The Chi-square test checks whether two categorical variables are associated.
Example: A research paper analysing whether gender is associated with preferred learning style (visual, auditory, kinaesthetic).
Prediction tests estimate how well one or more variables can predict an outcome. These are essential for quantitative dissertations and applied research.
Regression models help you understand how changes in one variable affect another.
Used when you want to predict an outcome using one predictor variable.
Example: Predicting sales revenue based on advertising spend.
Used when predicting an outcome using two or more predictors.
Example: Predicting employee performance from training hours, experience level, and motivation scores.
Used when the outcome variable is categorical (e.g., yes/no, pass/fail).
Example: Predicting the likelihood of a student passing an exam based on attendance and study habits.
Below are the most popular platforms students, researchers, and data analysts use for performing t-tests, ANOVA, correlations, regression, and more.
SPSS is one of the most widely used tools for academic research and dissertations.
R is a powerful, free, open-source programming language for advanced statistical analysis.
Python is one of the most popular languages for data science and machine learning.
Excel is a simple and accessible tool for basic statistical testing.
Both JASP and Jamovi are free, open-source alternatives to SPSS with a clean, modern interface.
Choose a statistical test by identifying your research question, determining variable types (categorical or continuous), checking how many groups you are comparing, assessing normality, and deciding whether your data is independent or related. Then match your goal, e.g. compare, correlate, or predict, to the appropriate test.
Parametric tests require normally distributed, continuous data and equal variances. Non-parametric tests do not assume normality and are ideal for small samples, ordinal data, or skewed distributions. Examples include Mann-Whitney, Wilcoxon, Kruskal-Wallis, and Friedman tests.
If your data is continuous and normal, use an Independent Samples t-Test. If the two groups are related (before-after), use a Paired t-Test. For non-normal data, use Mann-Whitney U for independent groups or Wilcoxon Signed-Rank for paired groups.
Use One-Way ANOVA for normally distributed continuous data and independent groups. For non-normal or ordinal data, use the Kruskal-Wallis Test. If the same participants are measured across conditions, use Repeated-Measures ANOVA or Friedman Test.
Use Pearson correlation for continuous, normally distributed data. Use Spearman correlation or Kendall’s Tau when the data is ordinal, skewed, or non-normal. For categorical variables, use the Chi-Square Test of Association.
Not always. Parametric tests like t-tests and ANOVA require normality, but non-parametric tests such as Mann-Whitney, Kruskal-Wallis, and Spearman correlation work even with non-normal or ordinal data.
For beginners, the easiest tests are the t-test, Chi-square test, and Pearson correlation because they have clear assumptions and straightforward interpretations.
You May Also Like

All work is written by human writers. 100% AI free, guaranteed.

100% money back guarantee if you find plagiarism in our work.
COMPANY DETAILS


